Carving the IcedId
[icedid malware network pcap mta tshark capinfos ja3 In a world dominated with endpoint detection and response agents, coming across PCAP may be a rare occurrence.
However, EDR and related acronyms only work if they are installed.
Sometimes it is not possible to install host based sensors on all devices. This may be because they are IOT devices or appliances such as printers, VOIP phones or network perimeter devices.
Sometimes sensors just don’t get installed on all of the internet facing hosts making it difficult to analyse an intrusion…breath
In any case, gathering PCAP might be the only way to investigate an intrusion, or at least provide some initial leads.
In the real world, you might find your big branded firewall, router, or VPN concentrator devices can generate PCAP.
Alternatively you may have dedicate network capture devices.
It is worth understanding what capabilities you have available to you. It may even be something to consider when you next upgrade the systems.
In this first blog post, I will display possible ways to quickly triage PCAP data, extracting key pieces of information and enriching that information with additional context.
I have taken a sample PCAP from Malware Traffic Analysis1 a fantastic resource maintained by @malware_traffic. You can download the same PCAP files from here.
This PCAP contains traffic relating to the icedid family of malware a modular banking malware2 and its operators.
In order to demonstrate the various techniques and how they can be applied to emerging threats, I will be treating this as a black box exercise with no ability to simply search for atomic indicators.
All of the generated output and scripts from this blog will be available for you to follow along should you wish over on Github.
Initial Triage
Before we start attempting to dig too deep into the analysis of any data its always good to confirm what data we have to analyse.
For PCAP files we can use the capinfos command to find out all the things.
$ capinfos 2023-08-09-IcedID-with-BackConnect-and-Keyhole-VNC.pcap
File name:           2023-08-09-IcedID-with-BackConnect-and-Keyhole-VNC.pcap
File type:           Wireshark/tcpdump/... - pcap
File encapsulation:  Ethernet
File timestamp precision:  microseconds (6)
Packet size limit:   file hdr: 65535 bytes
Number of packets:   20 k
File size:           11 MB
Data size:           10 MB
Capture duration:    12938.179454 seconds
First packet time:   2023-08-09 15:29:46.945490
Last packet time:    2023-08-09 19:05:25.124944
Data byte rate:      840 bytes/s
Data bit rate:       6,726 bits/s
Average packet size: 519.48 bytes
Average packet rate: 1 packets/s
SHA256:              4d06c317e8e28f4e74be330bdcd87cdb37ae7971648ca0c8248f3e7ead8792a7
RIPEMD160:           533b03acbfabdecc5e1133d13012d0be8abcf60d
SHA1:                2612d8dc088091ec3a3e8729a7ed0d6749d1e060
Strict time order:   True
Number of interfaces in file: 1
Interface #0 info:
                     Encapsulation = Ethernet (1 - ether)
                     Capture length = 65535
                     Time precision = microseconds (6)
                     Time ticks per second = 1000000
                     Number of stat entries = 0
                     Number of packets = 20940
Packet Statistics
Let’s start digging into the packets!
We can get a quick summary of the protocols in use using the tshark statistics features.
In the command below, -z io,phs instructs tshark to display Protocol Hierarchy Statistics.
You can find more possible statistics related options within the manual page3.
$ tshark -2 -n -z io,phs -q -r 2023-08-09-IcedID-with-BackConnect-and-Keyhole-VNC.pcap
For the sake of clarity, the following output has been reduced to highlight protocols of interest.
Protocol Hierarchy Statistics
Filter:

eth                                      frames:20940 bytes:10877998
  ip                                     frames:20298 bytes:10851034
    udp                                  frames:381 bytes:63780
      dns                                frames:268 bytes:32790
    tcp                                  frames:19917 bytes:10787254
      http                               frames:6 bytes:4245
        ocsp                             frames:1 bytes:1152
        text                             frames:1 bytes:1411
          tcp.segments                   frames:1 bytes:1411
        media                            frames:1 bytes:856
          tcp.segments                   frames:1 bytes:856
      tls                                frames:3696 bytes:2617915
        tcp.segments                     frames:622 bytes:613663
          tls                            frames:150 bytes:169696
      data                               frames:39 bytes:13723
      ldap                               frames:136 bytes:54988
        tcp.segments                     frames:28 bytes:25560
          ldap                           frames:8 bytes:11872
A Little More Conversation
Now we know how endpoints are talking over the network, next we can find out who is involved in all the conversations.
We can use a couple of additional statistic commands to find our “top talkers”.
Viewing the top talkers, allows us to see which endpoints are generating the largest amount of packets / bytes.
The statistics option -z endpoints,ip allows us to view the endpoints generating the most traffic.
$ tshark -2 -n -z endpoints,ip -q -r 2023-08-09-IcedID-with-BackConnect-and-Keyhole-VNC.pcap
Below shows the top 10 endpoints from the PCAP, you can find the full output here.
IPv4 Endpoints
Filter:<No Filter>
                       |  Packets  | |  Bytes  | | Tx Packets | | Tx Bytes | | Rx Packets | | Rx Bytes |
10.8.9.95                  20298      10851034       8149         4035536       12149         6815498
137.184.172.23             10122       3520549       5285          339187        4837         3181362
193.109.120.27              1944       2196654       1660         2177622         284           19032
10.8.9.9                    1896        481151        868          209318        1028          271833
23.63.72.218                1630       1642953       1283         1608655         347           34298
128.199.151.179              833        148238        440           99700         393           48538
172.67.140.91                568        583762        436          576325         132            7437
13.107.246.51                335        370820        282          364830          53            5990
52.137.106.217               322        340276        268          333433          54            6843
20.3.187.198                 239        165206        122           12305         117          152901
...
On the sample output above, there are a two IP addresses that stand out as noteworthy, based on the total bytes transferred.
137[.]184[.]172[.]23
193[.]109[.]120[.]27
This is not a definitive list of IOC’s but something we can start to pivot on around any other data you might have available in your environment.
At this stage during an investigation we could start researching each IP address, and in some cases this will yield some interesting results. As this PCAP is from a few months ago (at the time writing) these IP addresses likely show up in Threat intelligence reports.
Lets run another query to summarize conversations between hosts to see if there are any additional insights.
tshark -2 -n -z conv,ip_srcdst,tree -q -r 2023-08-09-IcedID-with-BackConnect-and-Keyhole-VNC.pcap
Below are the top 10 conversations based on the number of frames (frames encapsulate packets).
IPv4 Conversations
Filter:<No Filter>
                                               |       <-      | |       ->      | |     Total     |    Relative    |   Duration   |
                                               | Frames  Bytes | | Frames  Bytes | | Frames  Bytes |      Start     |              |
10.8.9.95            <-> 137.184.172.23          5285    339187    4837   3181362   10122   3520549    84.797226000     12848.9131
10.8.9.95            <-> 193.109.120.27          1660   2177622     284     19032    1944   2196654    80.201394000        73.4828
10.8.9.9             <-> 10.8.9.95               1028    271833     868    209318    1896    481151     0.000000000     12819.0497
10.8.9.95            <-> 23.63.72.218            1283   1608655     347     34298    1630   1642953  7883.866052000        53.2998
10.8.9.95            <-> 128.199.151.179          440     99700     393     48538     833    148238    82.942279000     12802.5170
10.8.9.95            <-> 172.67.140.91            436    576325     132      7437     568    583762    14.904654000       109.9738
10.8.9.95            <-> 13.107.246.51            282    364830      53      5990     335    370820  7880.200878000        56.9641
10.8.9.95            <-> 52.137.106.217           268    333433      54      6843     322    340276  6391.996704000        53.8537
10.8.9.95            <-> 20.3.187.198             122     12305     117    152901     239    165206  6688.981277000         1.3757
10.8.9.95            <-> 13.71.55.58              165    191607      35     10425     200    202032    85.311619000         6.6261
...
This view of the data shows us the duration of the connection, highlighting another IP address that might be worth investigating further.
128[.]199[.]151[.]179
IP Enrichment
Now we have collected some initial findings, we can enrich them to start building up a more detailed view.
At this stage we don’t know that anything we have identified is malicious. We are simply performing analysis on the data we have, in order to identify anything anomalous.
During an investigation on a larger scale with 10’s of millions of events streaming in constantly, its important to re-apply and re-asses what you know. It is also vital to understand what you don’t know and start forming some investigative threads.
Once the tasks have been broken down, collaboration means analysis can occur in parallel leading to faster more decisive remediation.
There are many web portals and API’s available to provide more information about indicators of interest.
Whilst these are good to individual lookups, this approach doesn’t scale terribly well.
For demonstration purposes I developed a simple script to query the free API from ipinfo.io. You can find the script here.
Using the following command (replace 0000000000 with your access token), we can feed the script a list of IP addresses via the file ips.txt.
$ python3 ./enrich_ip.py --token 0000000000 -f ips.txt
The script outputs the following details.
| IP Address | Organization | City | Country |
|---|---|---|---|
| 137.184.172.23 | AS14061 DigitalOcean, LLC | Toronto | Canada |
| 193.109.120.27 | AS62005 BlueVPS OU | Tallinn | Estonia |
| 128.199.151.179 | AS14061 DigitalOcean, LLC | Singapore | Singapore |
Whilst the above output might not provide hard hitting indicators that these are malicious, knowing how we can pivot on different data points such as the ASN organizations allows us to threat hunt for connections to IP addresses hosted by the same providers.
Attackers may either re-use infrastructure, or have a go to hosting provider they will re-use time and time again.
Having this intelligence picture build up over time allows us to identify trends in actor behaviour.
Remember, as we progress investigations you can visit this enrichment phase again.
Protocol Analysis
We identified some IP addresses, and we have some capability to gather some more insight into them.
Lets look closer into how they are being used in more detail.
DNS
The Domain Name System protocol is good stepping stone to traverse to higher level protocols. We have some IP address, now we can being to expand our view to see what domains are being resolved.
Of course, DNS is not only used for resolving domains to IP addresses.
There are many different query types4, the most important to understand being A, AAAA, CNAME. MX, NS and TXT.
To generate a summary of DNS activity within the PCAP we can use the DNS statistics in tshark with the following command.
$ tshark -2 -n -z dns,tree -q -r 2023-08-09-IcedID-with-BackConnect-and-Keyhole-VNC.pcap
This outputs a fairly large amount of information, but the key sections to look out for are the Query/Response and Query Type sections, shown below.
Topic / Item                   Count         Average       Min val       Max val       Rate (ms)     Percent       Burst rate    Burst start
----------------------------------------------------------------------------------------------------------------------------------------------
 Query/Response                268                                                     0.0000        100.00%       0.0600        7878.254
  Response                     134                                                     0.0000        50.00%        0.0300        7878.255
  Query                        134                                                     0.0000        50.00%        0.0300        7878.254
 Query Type                    268                                                     0.0000        100.00%       0.0600        7878.254
  A (Host Address)             262                                                     0.0000        97.76%        0.0600        7878.254
  SRV (Server Selection)       6                                                       0.0000        2.24%         0.0200        3541.155
...
As shown above there are 134 DNS queries made with matching responses, and 97.76% of the DNS activity were related to A records.
We can extract the domains being queried by using tshark’s ability to parse network protocols, DNS included.
Using the command below, we can filter for DNS type A query packets, and print out the query name field.
$ tshark -2 -n -T fields -e dns.qry.name -Y "dns.qry.type == 0x01 and dns.flags.response == 0" -q \
  -r 2023-08-09-IcedID-with-BackConnect-and-Keyhole-VNC.pcap > domains.txt
Note: you can find a copy of domains.txt here
In order to reduce the number of domains we will analyse further, I have created a domain_filter.txt file which can be
found here.
It contains domains we would expect to see on completely clean hosts and may interfere with our analysis moving forward.
Legitimate domains can be used for malicious purposes5, in some cases you may need to revisit domains previously excluded.
Using the new filter file, lets generate a count for the number of times each domain was requested.
$ grep -v -f domain_filter.txt domains.txt | sort | uniq -c | sort -nr
Which outputs the following…
 42 pokerstorstool.com
  1 smakizelkopp.com
  1 sb.scorecardresearch.com
  1 podiumstrtss.com
  1 metrics-a.wbx2.com
  1 edgeassetservice.azureedge.net
  1 deff.nelreports.net
  1 client-upgrade-a.wbx2.com
  1 binaries.webex.com
  1 associazionedignita.it
  1 9sta9rt4.store
Instantly one domain in particular looks to be an outlier: pokerstorstool[.]com due to its large amount of requests.
Domains with rare and uncommon Top Level Domain (TLD) also may be an indicator to look deeper into.
It’s not that these domains such as 9sta9rt4[.]store are always malicious, however anything anomalous is worthy of noting down.
For more information regarding trends in TLD’s being used for CyberCrime, you can view this dashboard by Netcraft
We have already added some IP addresses to our list of potential indicators of compromise, we can also use the DNS traffic to see what the domains we have extracted resolve to (at least at the time of this PCAP).
The below command will output the domain that was queried (dns.qry.name) followed by the answer(s) that was received (dns.a).
The command is then stored in domains_resolved.txt, which can be found here.
$ tshark -2 -n -q -Y 'dns.flags.rcode==0 && dns.flags.response==1' -T fields -e 'dns.qry.name' -e 'dns.a' \
  -r IcedID-with-BackConnect-and-Keyhole-VNC.pcap > domains_resolved.txt
We can view the output, applying the same domain_filter.txt as used before as follows.
$ grep -v -f domain_filter.txt domains_resolved.txt | column -t | sort | uniq
9sta9rt4.store                  81.177.140.194
associazionedignita.it          77.111.240.213
binaries.webex.com              18.64.183.33,18.64.183.41,18.64.183.69,18.64.183.29
client-upgrade-a.wbx2.com       170.72.231.0,170.72.231.161,170.72.231.10
deff.nelreports.net             23.220.206.9,23.220.206.47
edgeassetservice.azureedge.net  13.107.246.51,13.107.213.51
metrics-a.wbx2.com              170.72.231.161,170.72.231.10,170.72.231.0
podiumstrtss.com                172.67.140.91,104.21.54.162
pokerstorstool.com              128.199.151.179
sb.scorecardresearch.com        108.156.91.120,108.156.91.127,108.156.91.40,108.156.91.129
smakizelkopp.com                193.109.120.27
Note: It is quite common for domains to resolve to multiple IP addresses, applications will attempt them in order if one does not respond as expected.
It looks like there are some overlap between the domains and previously identified IP addresses.
| IP Address | Hostname |
|---|---|
| 193.109.120.27 | smakizelkopp.com |
| 128.199.151.179 | pokerstorstool.com |
We also now have the IP address that was linked to sta9rt4[.]store, which we can enrich further with the ip_enricher.py script from earlier.
$ python3 ./enrich_ip.py --token 0000000000 -i 81.177.140.194
| IP Address | Organization | City | Country |
|---|---|---|---|
| 81.177.140.194 | AS8342 JSC RTComm.RU | Moscow | Russia |
Whilst the uncommon TLD was a moderately weak signal, we can take this a step further and pivot on the AS6 Organization.
Taking the numerical value from the Autonomous System, to lookup the details at urlhaus.abuse.ch/asn/8342
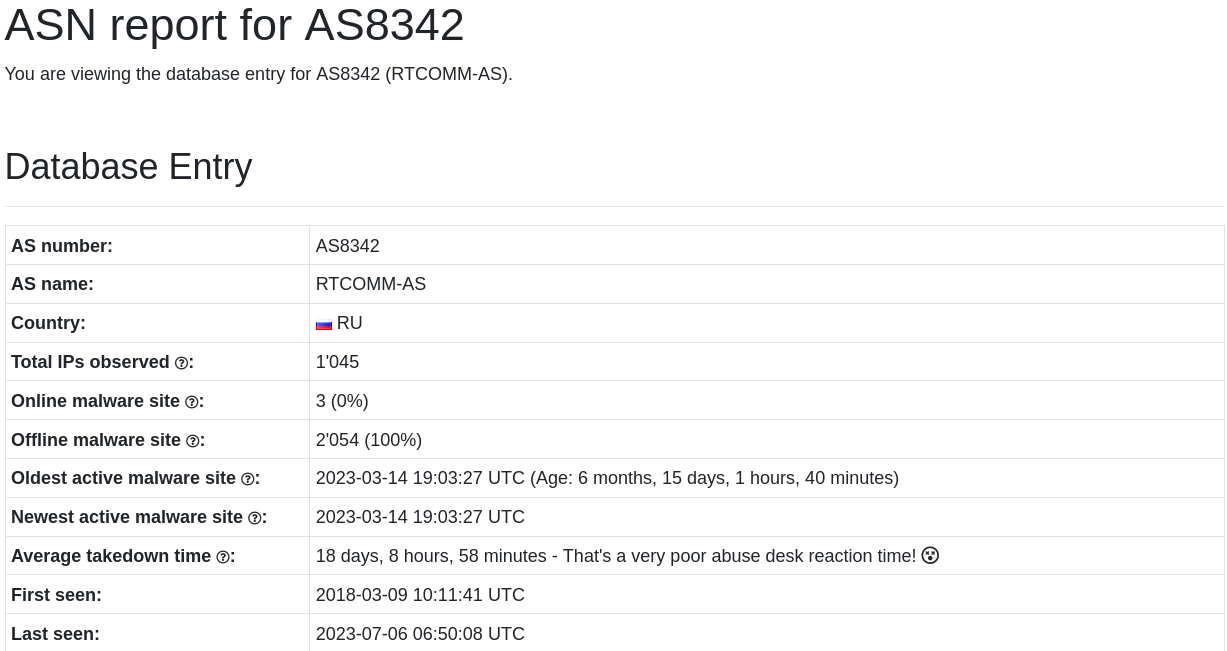
Screenshot from https://urlhaus.abuse.ch/asn/8342 taken 2023-09-25
It looks like this hosting Organization has hosted 2054 malicious domains previously and has had a fairly slow response time to taking them down.
That certainly has strengthened the domain sta9rt4[.]store indicator’s signal as likely being malicious.
Before continuing on with the analysis, lets summarize the entities we’ve extracted so far:
81[.]177[.]140[.]194193[.]109[.]120[.]27128[.]199[.]151[.]179137[.]184[.]172[.]23smakizelkopp[.]compokerstorstool[.]comsta9rt4[.]store
Domain Enrichment
Now we have some more data, its time to enrich to find out more.
For domains, we can query whois databases to find out more.
As we might end up with more, I wrote another script to help out.
You can find a copy of enrich_domain.py here
It has similar syntax to enrich_ip.py and can be used with a singular domain or be provided a list of domains via a file.
Note: Domains must be in an unsafe, fanged state for the script.
$ python3 ./enrich_domain.py -f domains.txt
smakizelkopp.com
	Creation: 2023-08-02 19:47:21
	Expiration: 2024-08-02 19:47:21
	Name: Slevin Toler
	Email: abuse@namesilo.com, skafertommy@outlook.com
	Address: 9951 Clear Run, West Jefferson, NC, 27510, US

pokerstorstool.com
	Creation: 2023-04-19 16:57:42
	Expiration: 2024-04-19 16:57:42
	Name: Wainwright Nordstrom
	Email: abuse@namecheap.com, wowasi5367@raotus.com
	Address: 7007 Silver Bear Carrefour, Westbriar, 3, 86777-1051, AF
Whilst there is nothing intrinsically linking the two domains, we have gathered some interesting information we can store and pivot on later.
The third domain, sta9rt4[.]store does not have any publicly accessible whois information available.
HTTP
During the protocol hierarchy analysis a small amount of HTTP traffic was detected. These days where most traffic is covered underneath TLS (SSL) encryption, seeing plain HTTP traffic is becoming somewhat rare.
Given it is such a small amount of the overall traffic lets take a deeper look into it.
We can continue to explore tshark3 statistics features using the -z http,tree option.
$ tshark -2 -n -z http,tree -q -r 2023-08-09-IcedID-with-BackConnect-and-Keyhole-VNC.pcap
This generates the following table with plenty of detail.
=======================================================================================================================================
HTTP/Packet Counter:
Topic / Item            Count         Average       Min val       Max val       Rate (ms)     Percent       Burst rate    Burst start
---------------------------------------------------------------------------------------------------------------------------------------
Total HTTP Packets      16                                                      0.0000        100%          0.0200        0.137
 HTTP Request Packets   13                                                      0.0000        81.25%        0.0100        0.137
  SEARCH                10                                                      0.0000        76.92%        0.0100        6457.028
  GET                   3                                                       0.0000        23.08%        0.0100        0.137
 HTTP Response Packets  3                                                       0.0000        18.75%        0.0100        0.204
  2xx: Success          3                                                       0.0000        100.00%       0.0100        0.204
   200 OK               3                                                       0.0000        100.00%       0.0100        0.204
  ???: broken           0                                                       0.0000        0.00%         -             -
  5xx: Server Error     0                                                       0.0000        0.00%         -             -
  4xx: Client Error     0                                                       0.0000        0.00%         -             -
  3xx: Redirection      0                                                       0.0000        0.00%         -             -
  1xx: Informational    0                                                       0.0000        0.00%         -             -
 Other HTTP Packets     0                                                       0.0000        0.00%         -             -

---------------------------------------------------------------------------------------------------------------------------------------
Starting with the HTTP Request Packets we have both GET and SEARCH, generally with malware we are interesting in GET and POST requests.
From those three GET requests we also have three responses with the code 200 OK, indicting resources were available and returned.
Parsing out some of the key fields using the following command we should start to be able to determine the purpose of the requests.
Note: The output below will be in CSV format, if you would like a header generated change ‘-E header=n’ to ‘-E header=y’
$ tshark -2 -n -Y 'http.request.method == GET' -T fields -e ip.dst -e tcp.dstport -e http.request.method -e http.request.uri \
  -e http.request.version -e http.user_agent -e http.host -E header=n -E separator=, -q \
  -r ../2023-08-09-IcedID-with-BackConnect-and-Keyhole-VNC.pcap > http.csv
Keen analysts amongst you may have noticed the inclusion of the http.host field.
This field is used by web servers to direct the request towards the correct virtual server or backend.
This feature can be abused using a technique called Domain Fronting, however it is also going to allow us to reduce the dataset by allowing us to filter out uninteresting domains.
We can use the domain_filter.txt list from the previous section as shown.
grep -v -f domain_filter.txt http.csv
This leaves us with one HTTP request which I have formatted into the following table.
| Field | Value |
|---|---|
| ip.dst | 172.67.140.91 |
| ip.dstport | 80 |
| http.request.method | GET |
| http.request.uri | / |
| http.request.version | HTTP/1.1 |
| http.user_agent | |
| http.host | podiumstrtss.com |
| http.cookie | __gads=4165079571:1:846:131; _gat=10.0.19045.64; _ga=1.591597.1635208534.1040; _u=4445534B544F502D34565A46525350:75736572313031:39414231333532444136393736323546; __io=21_3625792553_1955020779_2750360736; _gid=0078B91C290D |
Lets dissect the fields in order.
The ip.dst field provides us another IP address we can enrich further and ip.dstport shows the web server is running on the standard HTTP port.
Using the ip_enricher.py script, ipinfo.io informs us that this IP address belongs to Cloudflare, one of the largest CDN providers on the internet. Traffic destined to this IP address, with then HTTP Host header set, will have its traffic redirected to another server elsewhere.
| IP Address | Organization | City | Country Name |
|---|---|---|---|
| 172.67.140.91 | AS13335 Cloudflare, Inc. | San Francisco | United States |
The http.request.method, http.request.uri and http.request.version do not show anything of significant interest.
The blank http.user_agent is interesting, and I can’t think of an example before this where I have not seen the header specified.
The http.host may be of interest, and one we could cycle back around to look at in the DNS traffic.
We can also enrich the domain using the enrich_domain.py script.
$ python3 ./enrich_domain.py -d podiumstrtss.com
podiumstrtss.com
	Creation: 2023-04-19 16:08:52
	Expiration: 2024-04-19 16:08:52
	Name: Dyfan Terwilliger
	Email: abuse@namecheap.com, ubzeso@mailto.plus
	Address: 7226 Burning Landing, Euphemia, 36, 44200-6463, AF
A few things stand out that could indicate some relation between two of the domains.
Both podiumstrtss[.]com and pokerstorstool[.]com were registered within an hour of each other, with the same registrar.
The Address similarities are interesting and would need a larger sample set to prove anything, but humans are humans, and humans follow patterns.
| podiumstrtss.com | pokerstorstool.com | |
|---|---|---|
| Creation date | 2023-04-19 16:08:52 | 2023-04-19 16:57:42 |
| Registrar | Namecheap | Namecheap |
| Address | 7226 Burning Landing, Euphemia, 36, 44200-6463, AF |
7007 Silver Bear Carrefour, Westbriar, 3, 86777-1051, AF |
The http.cookie value does not obviously look out of place, HTTP cookies are standard practice however they can contain some important information if you are able to parse them.
The structure of cookies is complex, thankfully we can find out more about each parameter using cookiedatabase.org.
Taking __gads and _gat as examples, they both relate to Google statistics and analytics.
The value assigned to _gat might look familiar if you look closely enough: _gat=10.0.19045.64;.
If you have looked at Windows version strings enough as part of either system administration or threat analysis you might notice that the value 10.0.19045 is the Windows version string for Windows 10 Version 22H27, and we can probably hazard a guess that the 64 refers to a 64 bit installation.
Looking up the rest of the cookie parameters they all seem to be legitimately used somewhere for something. All of them, but one that is.
The _u parameter does not exist in the database, it could be new and undocumented, or it might be worth investigating more.
Hint: We’re going to look at it more.
_u=4445534B544F502D34565A46525350:75736572313031:39414231333532444136393736323546;
From looking at the values used its safe to assume that the data is hexadecimal encoded, with a : colon delimiter.
There are many tools we can use to convert hex values into ASCII.
As I’ll likely want to automate some analysis further, we can experiment with some Python one liners, using the binascii module.
Taking the above values
$ python3 -c 'import binascii; print(binascii.unhexlify("4445534B544F502D34565A46525350").decode())'
DESKTOP-4VZFRSP

$ python3 -c 'import binascii; print(binascii.unhexlify("75736572313031").decode())'
user101

python3 -c 'import binascii; print(binascii.unhexlify("39414231333532444136393736323546").decode())'
9AB1352DA697625F
Voilà, it appears we have a hostname: DESKTOP-4VZFRSP, a username: user101 and a mystery value: 9AB1352DA697625F
It’s not clear what the mystery value relates to without understanding the environment the sample was executing in.
As it appeared with the hostname of the machine and a username, perhaps its an instance ID or some kind of unique identifier used by some malware…
Earlier we generated a summary of source / destination conversations and stored it in src_dst_conversations.txt.
We can review the conversations regarding our new IP address using the sed command as shown.
$ sed -n '4,5p;  /172.67.140.91/{p}' src_dst_conversations.txt

                                               |       <-      | |       ->      | |     Total     |    Relative    |   Duration   |
                                               | Frames  Bytes | | Frames  Bytes | | Frames  Bytes |      Start     |              |
10.8.9.95            <-> 172.67.140.91            436    576325     132      7437     568    583762    14.904654000       109.9738
Note: prints lines 4 through to 5, the searches for lines that contain 172.67.140.91 and prints the line
This shows almost 58KB of data downloaded from the endpoint.
As this is HTTP we should be able to also export the downloaded data as a reassembled “object”.
$ tshark -r 2023-08-09-IcedID-with-BackConnect-and-Keyhole-VNC.pcap -q -2 -R 'ip.src==172.67.140.91' --export-objects http,http_output
Note: This command sets a Read filter for the host IP address, and exports the HTTP data into a directory called http_output
This extracts one file, which should be named %2f in the http_output directory, with the SHA1 hash of 36ab6e37ad59706cc03d2a17ed92d255a71b7618.
A quick examination of the file shows it is a GZIP compressed file with an original name of Light.txt.
$ file %2f

%2f: gzip compressed data, was "Light.txt", from FAT filesystem (MS-DOS, OS/2, NT), original size modulo 2^32 3601146
Ordinarily we would usually then use either zcat, gzip -d or gunzip to then decompress the file.
This sample however appears to be corrupt and does not extract as expected.
TLS
Our final protocol to dissect is Transport Layer Security, TLS.
TLS provides a protocol to allow two endpoints to securely communicate using a variety of encryption algorithms. Many protocols can be wrapped within a TLS tunnel, the most common is probably HTTP, which is commonly referred to as HTTPS.
Clients
Like many other protocols there is a handshake initiated by the client with what’s called a Client Hello handshake.
Within this initial packet, the client will provide several pieces of information including but not limited to:
- Server Name Identifier (SNI)
- Cipher Suites
The Server Name Identifier works in a similar way to the Host header in HTTP, it provides the domain name the client is expecting to communicate to.
The Cipher Suites section provides an ordered list of cryptographic protocols that the client supports.
This list is then enumerated and if the server finds one it can also use, this will be selected. More on this later.
We can view the TLS Client Hello details using the following tshark command.
$ tshark -r 2023-08-09-IcedID-with-BackConnect-and-Keyhole-VNC.pcap -q -2 -R 'tls.handshake.type==1' \
  -T fields -e ip.dst -e 'tls.handshake.extensions_server_name' -e 'tls.handshake.ciphersuite'  \
  > tls_client_hello.txt
To view the cipher suites of domains we might be interested in, we can use grep to filter out known good domains.
$ grep -f domain_filter.txt tls_client_hello.txt
As I eluded to, this list of cipher suites is ordered. The order is generated typically by the library functions in use by an application.
It is of course possible for clients to specify a preferred list of cipher suites itself, overriding the default values.
Whilst dealing with lists of numerical hexadecimal values works on a small scale, there is in fact a standard approach to fingerprinting cipher suites.
This technique is known as the JA3 Hash and was developed by Salesforce.
This technique summarizes various fields into an MD5 hash digest.
This algorithm has been ported over to common network monitoring suites and thankfully a Python script8.
We can generate a JA3 hash for each TLS Client Hello packet as shown.
$ python3 ja3.py ../2023-08-09-IcedID-with-BackConnect-and-Keyhole-VNC.pcap > tls_client_hello_ja3.json
Just to make the output a little easier to work with use the following commands to create a new file tls_client_hello_ja3.txt
$ cat tls_client_hello_ja3.json
  | jq '.[] | [.destination_ip, .ja3_digest]' \
  | jq -c '.' \
  | sed -e 's/\[\"//g' -e 's/\",\"/,/' -e 's/\"]//' > tls_client_hello_ja3.txt
If we filter for IP addresses of interest we have gathered along the way, found in ips.txt we can see what JA3 hash was used by the client.
$ grep -F -f ips.txt tls_client_hello_ja3.txt | sort | uniq -c
 43 128.199.151.179,a0e9f5d64349fb13191bc781f81f42e1
  4 193.109.120.27,a0e9f5d64349fb13191bc781f81f42e1
  1 81.177.140.194,3b5074b1b5d032e5620f69f9f700ff0e
Both IP address were connected to with the same JA3 hash a0e9f5d64349fb13191bc781f81f42e1.
We can pivot from the JA3 hash value back to also see what IP addresses were also contacted.
$ grep -F -e 'a0e9f5d64349fb13191bc781f81f42e1' tls_client_hello_ja3.txt | cut -f 1 -d ',' | sort | uniq -c | sort -nr
 43 128.199.151.179
  4 193.109.120.27
  1 18.64.183.33
  1 170.72.231.161
  1 170.72.231.0
$ grep -F -e '3b5074b1b5d032e5620f69f9f700ff0e' tls_client_hello_ja3.txt | cut -f 1 -d ',' | sort | uniq -c | sort -nr
Interestingly this JA3 hash was also used to connect to 77[.]111[.]240[.]213 (associazionedignita[.]it), so might also be another lead to follow.
  1 81.177.140.194
  1 77.111.240.213
Going back and forth and seeing how entities link together provides you with some relevant data you might be able to apply to a much larger data set. This is a very basic form of threat hunting, congratulations you’re a threat hunter now.
One last exercise to the reader, there is also JA3S which combines the client hash worth details from the Server Hello packet which again can be processed as shown with the clients.
Pivoting around on that data point may also reveal more potential C2 servers.
Servers
Just like the TLS Client Hello the server side responds in kind with a TLS Server Hello.
The Server Hello contains many fields, in essence it allows the two peers in the connection to establish trust and decide on cryptographic parameters to secure the conversation.
As part of this exchange the Server will return its own TLS certificate which we can examine further with the following command.
This command will filter for the TLS Server Hello packet in the handshake, print the server IP along with the UTF8Strings from the Selected Attribute List which in this case is the certificate issuer. The final field displayed is taken from the X509af (Authentication Framework) and displays utcTime entities, which in this case is the date the certificate was issued and when it will expire.
We are also using grep to filter for IP addresses we are interesting in, contained within the ips.txt file.
$ tshark -r 2023-08-09-IcedID-with-BackConnect-and-Keyhole-VNC.pcap  -q -2 -R "tls.handshake.type == 2" \
  -T fields -e 'ip.src' -e 'x509sat.uTF8String' -e 'x509af.utcTime' | \
  sort | uniq | grep -f ips.txt
The output from the above command can be quite large, so to help I have manually formatted the information into this table.
| Server IP | Issuer | Valid From | Valid To |
|---|---|---|---|
| 128.199.151.179 | localhost, Some-State, Internet Widgits Pty Ltd |
23-08-09 10:19:22 (UTC) | 24-08-08 10:19:22 (UTC) |
| 193.109.120.27 | localhost, Some-State, Internet Widgits Pty Ltd |
23-08-05 12:34:13 (UTC) | 24-08-04 12:34:13 (UTC) |
We discovered earlier, during the domain enrichment phase that one of the domains (smakizelkopp[.]com) which resolved to 193[.]109[.]120[.]27 was registered at 2023-08-02 19:47:21 a few days prior to the TLS certificate being created.
This helps us timeline potential infrastructure setup for a malicious actor and allow us to pivot for further activity in the time period.
We can tell this is a self signed certificate based on the Internet Widgits Pty Ltd string, this us a well known default identifier used in Certificate Signing Requests generated by OpenSSL.
This pretty much ends our triage analysis for now, we have generated potential IOC’s we can search for in whatever data sets you have available, and also began to map the infrastructure being used for this campaign.
Although we started with quite an already filtered PCAP, hopefully parts of the methodology outlined can be adapted over time across larger data sets.
Conclusion
If you have made it all the way down to the end, I really appreciate it.
This blog post turned out a lot longer than I had originally planned, but I hope you learnt something or got an idea for some ways this process can be automated.
If you enjoyed it let me know, I plan to cover more varied topics in the future, not just PCAP so stay tuned.
Until next time, keep evolving…