Carving the IcedId - Part 3
[icedid malware x64dbg dynamic unpacking shellcode injection radare2 Welcome back to this series, analysing IcedId malware artefacts.
This is part 3 in the series, you can check out part 1 and part 2 to follow along from the beginning.
This post will focus on analysing a DLL file that was downloaded using a PowerShell script analysed in previously in part 2.
The data for this case was published by @malware_traffic over at Malware Traffic Analysis1. You can download all the samples from this case from here.
This analysis has really stretched my learning regarding unpacking, it has by far been the most challenging and rewarding sample I’ve come across to date. If there are any errors that you spot, I’d really welcome the feedback to understand better how this sample works.
In order to make this walk through as accessible as possible, I will once again be storing artefacts and output in a GitHub repository here.
The GitHub repository contains the extracted shellcode as seen in the various commands for your own experimentation, as well as the final payload.
TL;DR
This post is fairly detailed and as a result quite long. A quick overview of how the sample executes is listed below to provide some quick insight. If you want a more guided tour of the execution and other interesting observations, skip this section.
-
rundll32.exeexecutes a export on the dll. -
The DLL routine allocates some memory and copies and unpacks data into shellcode from the
.relocsection of the DLL. -
The unpacking consists of a 4 byte XOR as well as the supplied string on the command line, for various stages.
-
The unpacked shellcode is patched with function addresses and creates some
syscallstubs to avoidntdll.dllhooks. -
The
rundll32.exeprocess openssvchost.exeand injects a payload using shared mapped views of sections andNtQueueUserThread -
The
svchost.exeprocess further unpacks a PE file which is then injected into memory at a fixed location. -
The injected payload is then executed.
-
The final payload can be downloaded from the Bazaar or GitHub
In the previous post, a PowerShell script was used to download a DLL named r.dll from a compromised WordPress instance.
Part of the script appended varying amounts of bytes to the file, ensuring the cryptographic hash changes with each download.
You can find a copy of the DLL file on the Malware Bazaar, here
The SHA1 hash for the copy we will be looking at in this post is: 1c6e76af95f2a17b8e518965d62b3c9d7ecba6d5
For this explanation of the malware delivery, both static and dynamic analysis will be used in conjunction.
For static analysis I am using radare22 and for dynamic analysis x64dbg3 both are freely available.
Binary File Triage
From the Powershell script we know there must be an export named vcab, we can use a radare2 one-liner to show the various exports.
$ r2 -c 'iE' r.dll
[Exports]
nth paddr      vaddr        bind   type size lib             name                               demangled
―――――――――――――――――――――――――――――――――――――――――――――――――――――――――――――――――――――――――――――――――――――――――――――――――――――――――
1   0x00000420 0x814e361020 GLOBAL FUNC 0    msys-edit-0.dll t_gcc_deregister_frame
2   0x00000400 0x814e361000 GLOBAL FUNC 0    msys-edit-0.dll t_gcc_register_frame
3   0x000151e0 0x814e375de0 GLOBAL FUNC 0    msys-edit-0.dll tel_fn_complete
4   0x000192c0 0x814e379ec0 GLOBAL FUNC 0    msys-edit-0.dll trl_abort_internal
5   0x00026338 0x814e38a138 GLOBAL FUNC 0    msys-edit-0.dll trl_print_completions_horizontally
6   0x000192f0 0x814e379ef0 GLOBAL FUNC 0    msys-edit-0.dll trl_qsort_string_compare
7   0x00016bf0 0x814e3777f0 GLOBAL FUNC 0    msys-edit-0.dll tdd_history
8   0x000169a0 0x814e3775a0 GLOBAL FUNC 0    msys-edit-0.dll tppend_history
9   0x00000880 0x814e361480 GLOBAL FUNC 0    msys-edit-0.dll t__next_word
10  0x00000800 0x814e361400 GLOBAL FUNC 0    msys-edit-0.dll t__prev_word

[ TRUNCATED ]

152 0x000177a0 0x814e3783a0 GLOBAL FUNC 0    msys-edit-0.dll tistory_expand

[ TRUNCATED ]

430 0x00016fb0 0x814e377bb0 GLOBAL FUNC 0    msys-edit-0.dll there_history
431 0x000177a0 0x814e3783a0 GLOBAL FUNC 0    msys-edit-0.dll vcab
The above output is truncated, however you can see there are 431 exports on this DLL. The final export listed is the vcab export we already know about. You can find a full output of the command in the GitHub repository for this blog posts, here.
As well as the export names, the virtual addresses are also quite interesting. Looking at the export tistory_expand, ordinal 152, we can see it has the same virtual address as the vcab export.
Given the large amount of exports I believe this is likely a legitimate DLL file that has been modified with some additional functionality.
Searching for the DLL name msys-edit-0.dll also shows this is possibly related to the msys2 project.
Since we’ve looked at Exports, lets look at Imports, using the following command.
$ r2 -c 'ii' r.dll
[Imports]
nth vaddr        bind type lib          name
――――――――――――――――――――――――――――――――――――――――――――
1   0x814e391860 NONE FUNC KERNEL32.dll GetModuleHandleA
One import is not a lot to go off for understanding the functionality. The lack of imports is also quite suspicious, and something that indicates this DLL should be investigated further.
Statically analysing the DLL functions proved a little harder than expected. Forcing Ghidra to decompile the bytes was possible, but readability was not amazing.
To explore this sample further, I will be combining both static and dynamic analysis techniques.
Debugger Setup
For the dynamic analysis parts of this you will require some working knowledge of x64dbg. Primarily around setting breakpoints, although the commands are provided, just knowing what a breakpoint is and how to set it should be enough. If something isn’t clear feel free to reach out and ask!
As well as the vcab entry point being supplied on the command line, a flag /k and string parameter were also provided as shown below.
rundll32 r.dll, vcab /k chokopai723
To look into the execution of the DLL I’ll be using x64dbg.
It is possible to use the x64dbg DLL host binary, however for this analysis, debugging will be done with rundll32.exe executable in order to mimic the execution environment precisely.
Once you have opened the binary C:\Windows\System32\rundll32.exe with x64dbg change the command line to include the additional parameters as shown in Figure 1.

Figure 1: x64dbg - Additional command line parameters.
I find it helpful when analysing a new sample to setup breakpoints on DLL loads, which helpfully is a built in feature.
Navigating to Options and then Preferences you can enable the settings User DLL Load and System DLL Load.
Execute until the r.dll is loaded and then issuing the following command in will set a breakpoint on the vcab entry point.
bp r.vcab
We should also set some breakpoints for interesting API calls before starting, using the following commands.
These API’s specifically have been selected because VirtualAlloc is common in packed samples to aid in unpacking, and since the number of Imports was limited to a single Kernel32.dll library, there is a chance the sample will attempt to load more modules manually.
bp VirtualAlloc
bp LoadLibraryA
Command Line Validity Check
The first routine to highlight during this walk through is a check that the /k was supplied on the command line. Setting a breakpoint at 0x814e378887 and viewing the sample statically we can see the ASCII characters 0x6B and 0x2F being moved into a memory region, as shown in Figure 2.
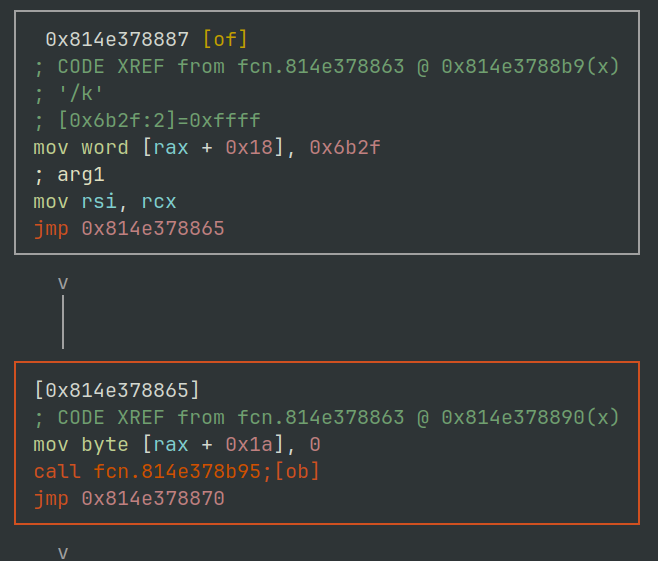
Figure 2: radare2 - r.dll command line check routine.
An instruction at 0x0814E378AAB then copies these two bytes into the RDX register. The command line string is then iterated over scanning for the /k flag being present. If its not then the execution flow exits.
Memory Copy Routine
The next routine of interest is located at virtual address 0x0814E378B26.
This routine is used throughout this portion of the loader to essentially move bytes from one location to another, much like the memcpy4 function.
The function prototype for memcpy is shown below, and this is also used by the routine within the sample.
In x86_64 assembly the registers RCX, RDX and R8 are used to store the destination , source and count (size) parameters.
void *memcpy(
   void *dest,
   const void *src,
   size_t count
);
Although the function is located at 0x0814E378B26, the primary loop that moves data between source and destination can be seen at 0x814E378B71.
The disassembly for this routine is shown in Figure 3 below.
The register RDX is used as an index to then increment as it loops through the bytes being copied.

Figure 3: radare2 - IcedId memcpy shellcode routine.
Setting a breakpoint at 0x0814E378B26 will allow us to inspect the various bytes being moved around.
bp 0x0814E378B26
If we allow execution until the memory copy routine breakpoint, we first see a call to copy the string chokopai723 from one area on the stack to another stack based memory location.
Figure 4 shows the source address 0x0F340F0F44A, destination 0x0F340F0F5B0 and the number of bytes 0xB
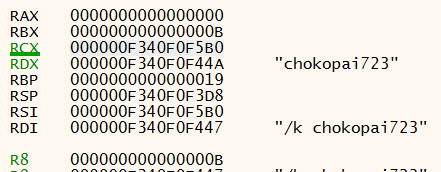
Figure 4: x64dbg - Memory copy routine register usage
Allowing the execution to proceed, the debugger will break at a call to VirtualAlloc5. If we examine the supplied parameters we can mock-up a call to VirtualAlloc with the following values.
VirtualAlloc(NULL, 0xE27, 0x3000, 0x4);
Converting some of the inputs to their constants5 6 makes it a little easier to understand what is happening.
VirtualAlloc(NULL, 0xE27, MEM_COMMIT|MEM_RESERVE, PAGE_READWRITE);
Here we can see at least 0xE27 (3623) bytes of memory is being requested, to be committed and reserved, with the page protection of Read and Write.
The value returned in the EAX register is going to be one to keep an eye on. This value is the address of an allocated region of memory.
As this value changes from execution to execution I will refer to this as “memory region 1” throughout this post.
This allocated region of memory is then populated using the malware’s implementation of memcpy already covered (0x0814E378B26).
The routine is called a total of 3 times, the total number of bytes copied matches the requested region size of 0xE27 (3623) bytes.
Each time, the source of the data is located in the .reloc section of the DLL.
The table below describes the source virtual address, the file physical offset, and number of bytes copied.
| Source Virtual Address | File Offset | Byte Count |
|---|---|---|
| 0x0814E3949E5 | 0x2B9E5 | 0x4A (74) |
| 0x0814E394A2F | 0x2BA2F | 0x18F (399) |
| 0x0814E394BBE | 0x2BBBE | 0xC4E (3150) |
The file offset can be calculated using the source address seen in the debugger, minus the virtual address of the section (.reloc). Then identifying the physical address of the section within the PE file using the headers, and adding the difference back.
Using x64dbg’s memory map tab you can save this memory region to a file, you can find a copy of the file rundll32_memory_region_1.bin in the Github repository here.
Either using the offsets identified or by dumping the memory region, we can examine the data copied in more detail. Data mysteriously copied into un-backed memory region has potential to be shellcode.
We can test this theory by attempting to disassemble the bytes in using this radare2 one-liner.
Figure 5 shows the interpretation of the bytes as assembly. It appears to be junk as there is no obvious flow of execution present.
$ r2 -AA -c 'pd' rundll32_memory_region_1.bin
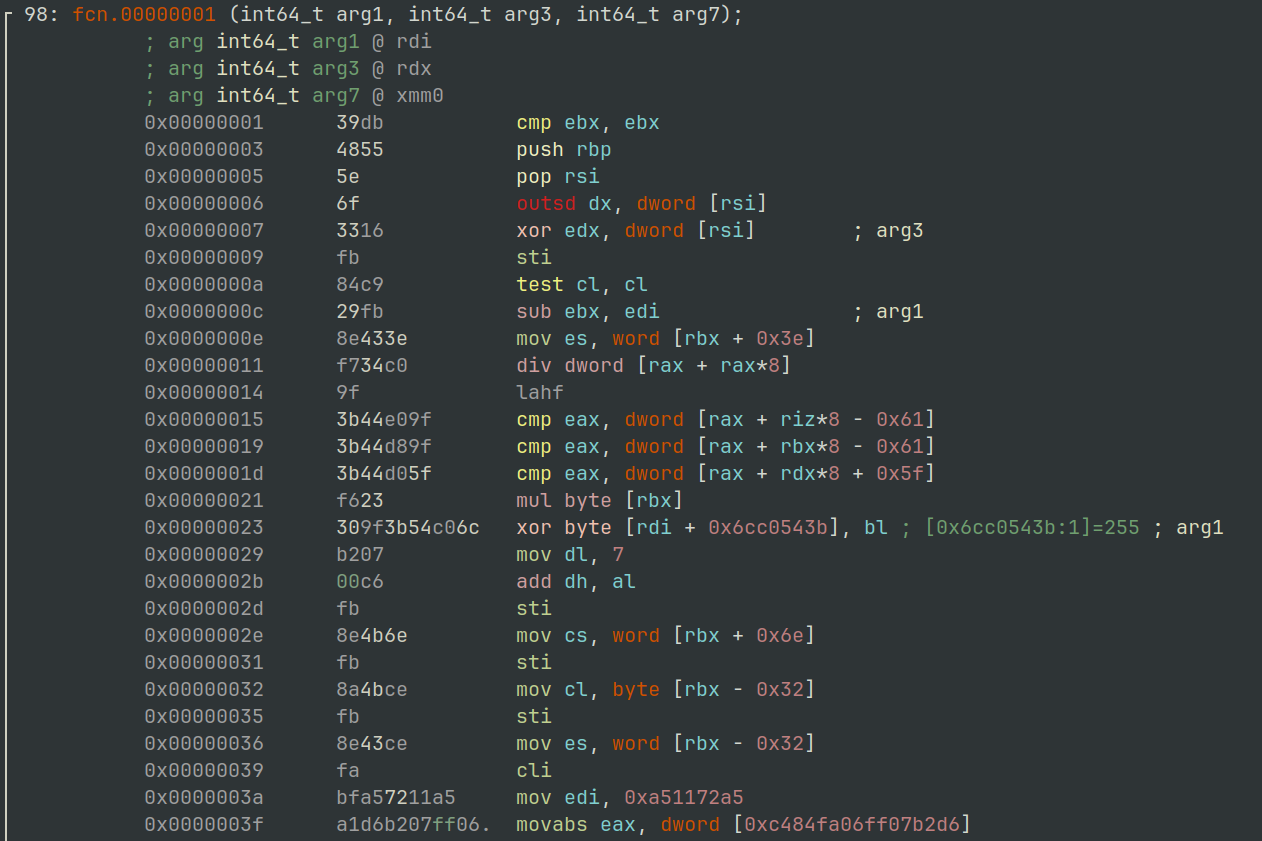
Figure 5: radare2 - Disassembly view of allocated memory region #1
It’s a good idea at this point to set an Access breakpoint on the memory region to see if there are any routines that may transform it in some way.
Executing the process again will break when the process attempts to access an address within the allocated region of memory.
The cause of this is an XOR operation at 0x0814E3784E8 as shown in Figure 6.

Figure 6: x64dbg - XOR operation memory region #1
The screenshot in Figure 6 above and in Figure 7 below show this XOR taking place both from a dynamic and static perspective.
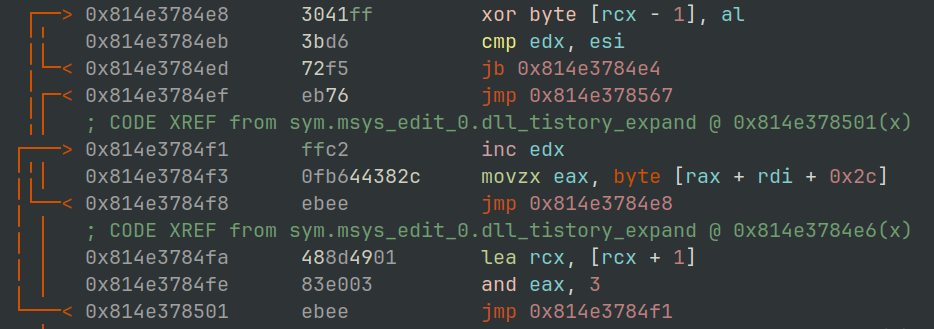
Figure 7: radare2 - XOR operation memory region #1
The AL register in this case is the lower 8 bytes of the EAX register.
The register pane on the right in Figure 7 shows this to contain the value 0xD6.
The address the operation is being carried out on in this case is shows as ds:[rcx-1] which if we take a look at the value in the RCX register should contain the address of the second byte within memory region 1, the -1 them refers to the first byte of our mystery data.
If we step through the next few operations hitting the XOR instruction we eventually see the same 4 bytes rotating through the AL register: 0xD6B20700
This raises an interesting question, where are these bytes coming from and can locate them within the DLL file?
We know from observing the routine, that the bytes used for the XOR key is being set in the EAX (AL) register.
Within the screen shot shown in Figure 7 you may notice the operation at 0x0814E3784F3, also shown below.
movzx eax,byte ptr ds:[rax+rdi+2C]
This is the operation setting the value of the EAX/AL register prior to the XOR operation. If we follow the address calculated at RAX + RDI + 2C in a dump we can see the 4 bytes at the address 0x0814E378BD4 or file offset 0x17FD4, as shown in Figure 8.

Figure 8: hxd - hexadecimal dump of potential configuration block
Shown in the GREEN box, is the XOR key. Also within short proximity, shown in BLUE there are the sizes (in little endian7) of the data transferred into the first allocated memory region.
Lastly within the RED box, there is a NULL terminated string of init. This could be a useful marker for what might turn out to be some kind of stored configuration.
If we allow the XOR routine to complete its rounds across the data, and repeat the steps from earlier to dump, and then attempt to show the disassembly it now prints some pretty convincing shellcode.
The file rundll32_memory_region_1_xor.bin can also be found in the GitHub repository here
$ r2 -AA -c 'pd' rundll32_memory_region_1_xor.bin
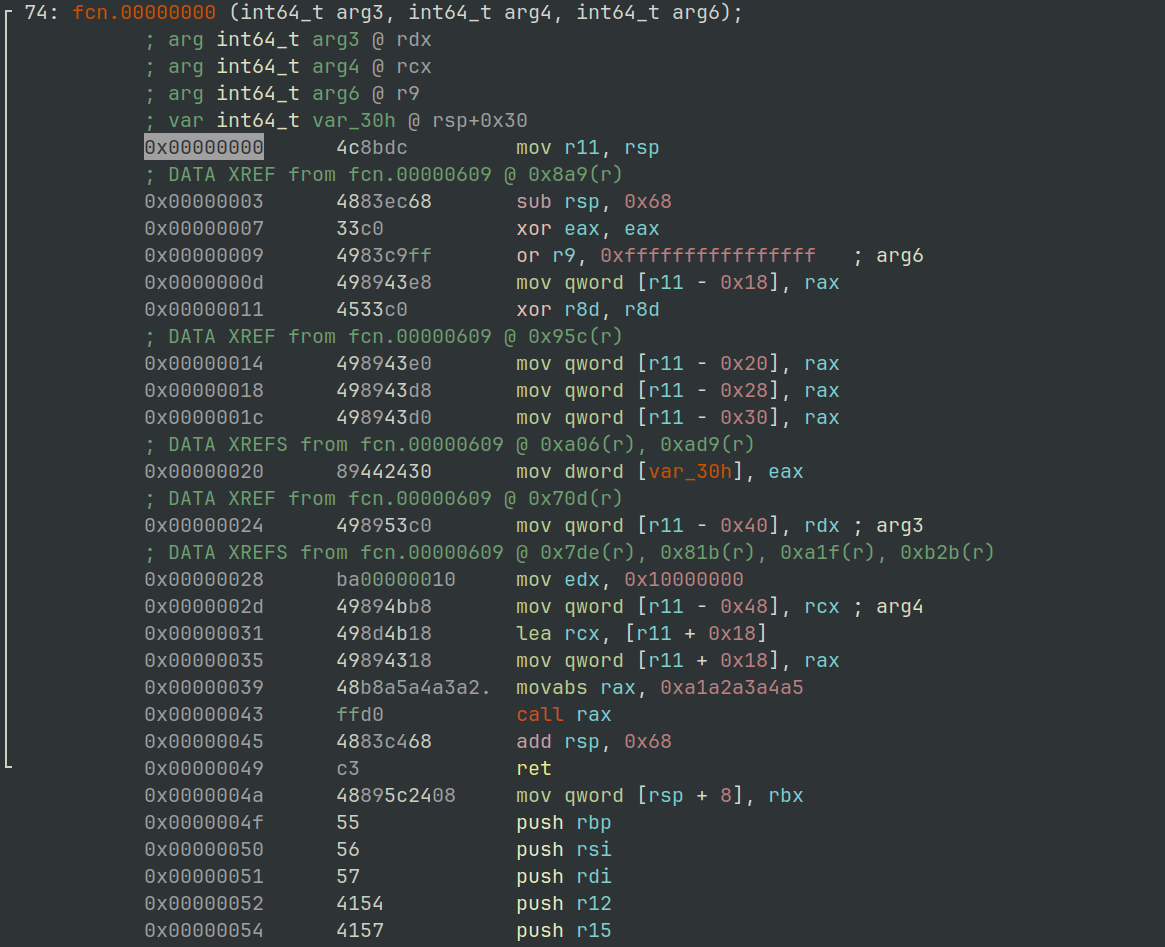
Figure 9: radare2 - Shell code disassembly
We can validate that the XOR key is correct by applying it to the memory dump file we created previously and comparing the output. Figure 10 shows the recipe required. You will notice the hexadecimal output matches the instruction bytes in the disassembly above, in Figure 9.

Figure 10: CyberChef - XOR routine.
If we remember the call to VirtualAlloc previously, the region was requested with PAGE_READWRITE protection, restricting the ability for execution. There are two possibilities for the shellcode now, the first is it will be executed in its current location or it will be copied somewhere else before executing.
Wherever the shellcode will be executed, the memory region will need its execute permission set.
Just as VirtualAlloc was used to allocate the region, we can set a break point on VirtualProtect as shown below.
bp VirtualProtect
Sacrificial DLL Loading
Pressing on with the unpacking, there is a call to LoadLibraryA with the parameter to load the DLL dpx.dll from the default C:\Windows\System32 directory.
Loading the dpx.dll library is followed by locating an exported function named dpx.DpxCheckJobExists.
Based on my loose understanding of how the function is located, I believe this is chosen simply because it is the first function listed in the exports.
This technique would allow the malware authors to potentially swap the dpx.dll for another fairly easily…
The address returned from for dpx.DpxCheckJobExists is then passed to VirtualProtect8, executed via a call r15 instruction at 0x0814E3786BE.
The arguments passed to VirtualProtect can be arranged as shown.
This function call will mark 0x15BB (5563) bytes as PAGE_READWRITE starting at the address of dpx.DpxCheckJobExists.
VirtualProtect(dpx.CheckJobExists, 0x15BB, 0x4)
The original protection was PAGE_EXECUTE_READ, so the additional permission to allow writing is enough to know we likely want to keep an eye on this region.
Moving on, we hit a familiar breakpoint for the malware’s memcpy routine.
This time, 0x15BB bytes are being moved from the address 0x0814E39342A once again located in the .reloc section, to the address of dpx.DpxCheckJobExists.
The file offset for this data is 0x2A42A.
Rather interestingly the bytes representing the amount of data transferred 0x15BB are located in the output of Figure 8 underneath the 0x4A byte.
Extracting the 0x15BB bytes from the newly copied location, we can take a look and see what the original code for dpx.DpxCheckJobExists has been replaced with.
$ r2 -AA -c 'pd' rundll32_dpx_checkjobexists.bin
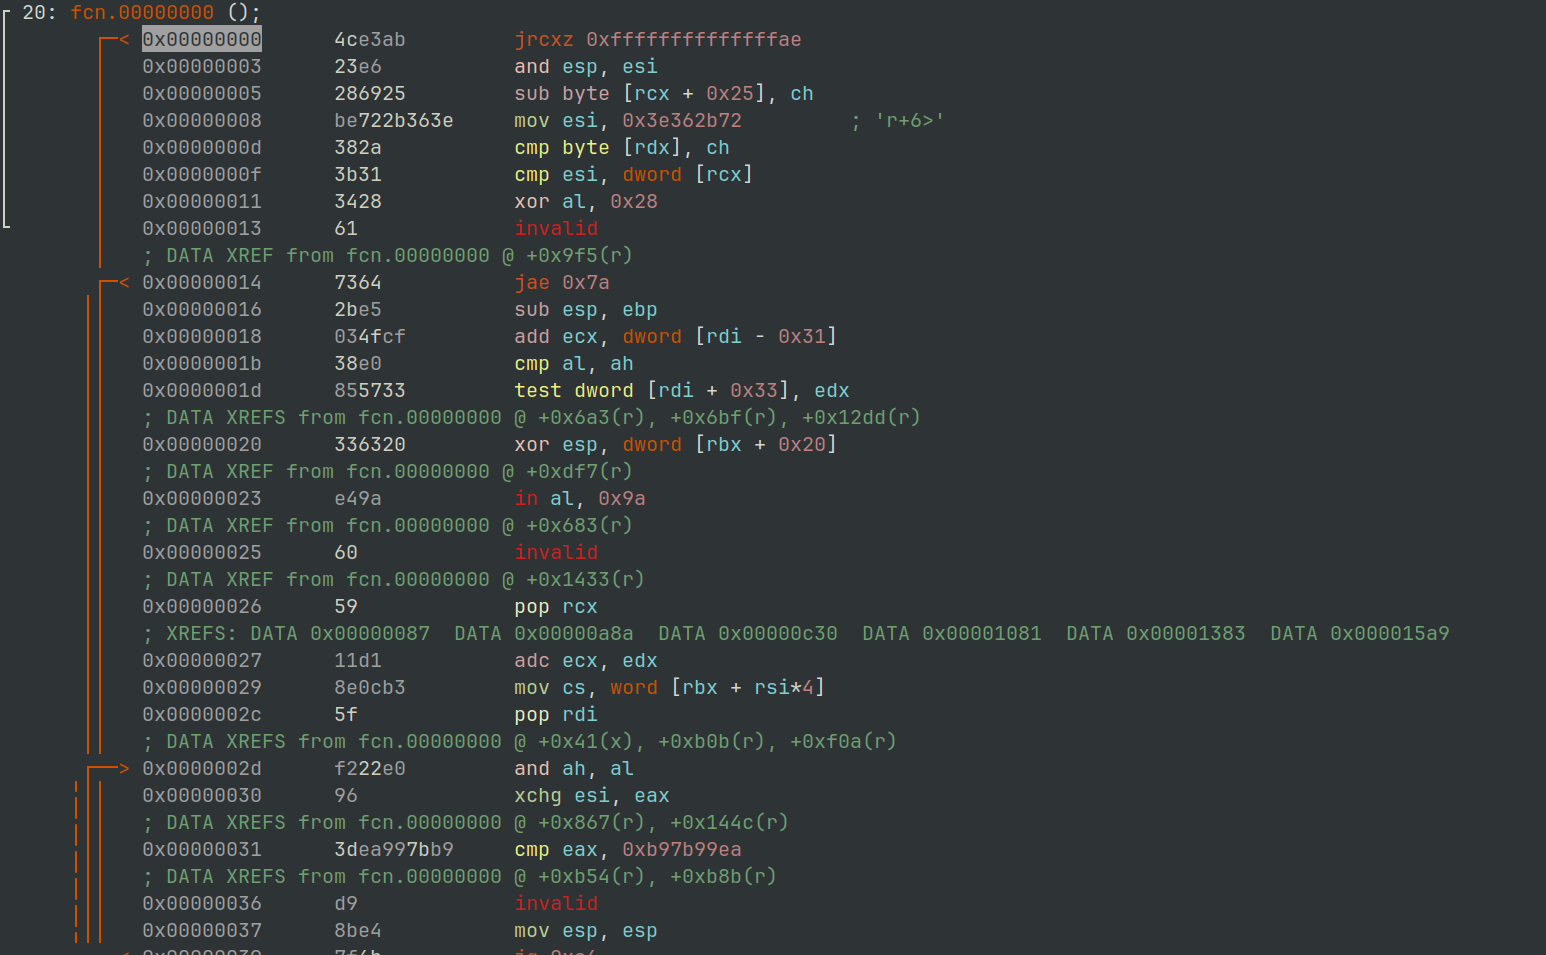
Figure 11: radare2 - Dpx.CheckJobExists overwritten data
It doesn’t look shellcode, so likelihood is there will be an additional routine to de-obfuscate it.
Through setting some access breakpoints you will stumble elegantly upon yet another routine with an XOR instruction located at 0x0814E3786E1.
This routine iterates over the dpx.DpxCheckJobExists location using the string chokopai723 as a key for all 0x15BB bytes.
The string chokopai732 was passed into the process via the command line flag /k.
If we take a look at the dpx.DpxCheckJobExists contents shown in Figure 12, once the XOR has been applied we get something more resembling shellcode.
$ r2 -AA -c 'pd' rundll32_dpx_checkjobexists_xor.bin
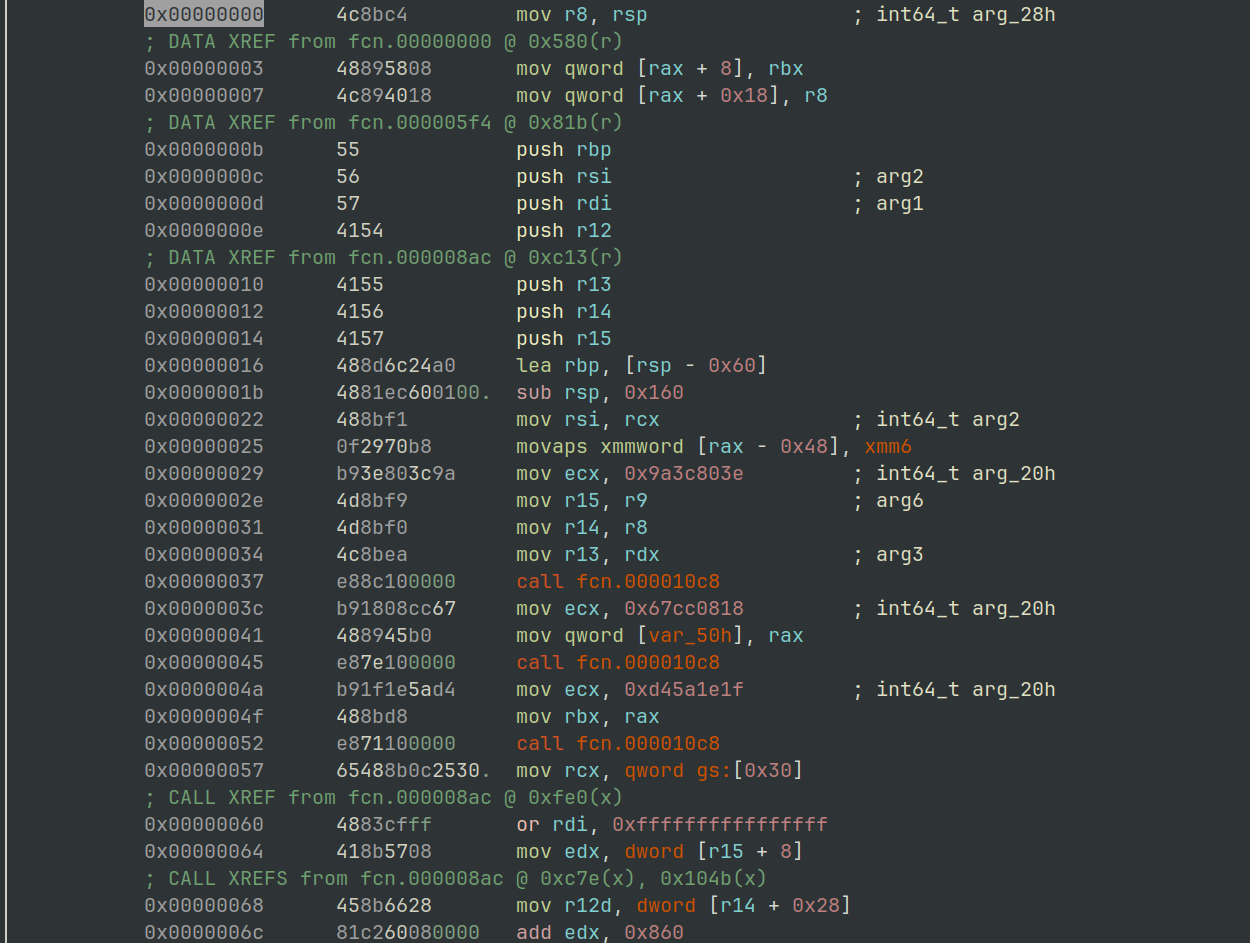
Figure 12: radare2 - Dpx.DpxCheckJobExists shellcode
The sample then makes another call to VirtualProtect, restoring the page protection on dpx.DpxCheckJobExists back to PAGE_EXECUTE_READ.
Now the code is executable again, the sample executes the newly laid out shellcode by call rsi operation at 0x0814E378421.
This can be intercepted by setting a breakpoint on the dpx.DpxCheckJobExists symbol.
Executing the shellcode located at dpx.DpxCheckJobExists, it uses an internal routine labelled below as mw_resolve_api_hash_location to locate the procedure addresses for 3 API’s. The use of API hashes to resolve routines is quite common in malware, as it makes it much harder to see what is being used.
The hash values are usually fairly static, although there a few different methods employed, “search engine-ing” the hexadecimal values is the first step.
Special thanks to this GitHub project by hidd3ncod3s for supplying the hashes and corresponding API routines.
From the following disassembly we can see 3 values being moved into ECX before the function mw_resolve_api_hash_location is used.
The labels in the disassembly, show the methods being passed:
- NtCreateThreadEx (
0x9a3c803e) - RtlAllocateHeap (
0x67cc0818) - RtlFreeHeap (
0xd45a1e1f)
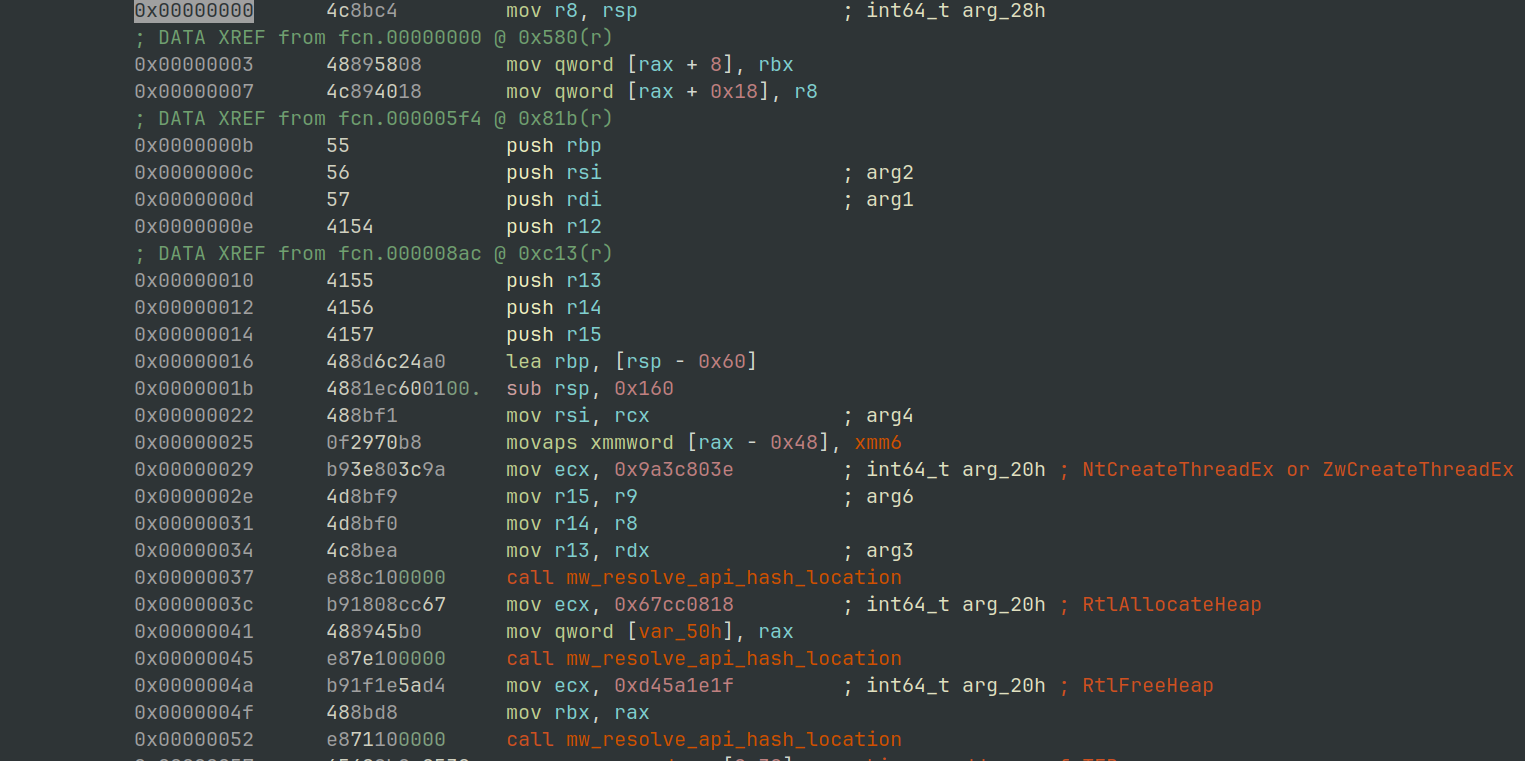
Figure 13: radere2 - API hashes being resolved.
Once the API’s have been resolved, the routine RtlAllocateheap9 is called using the call rbx instruction, and 0x335B (13147) bytes are requested.

Figure 14: x64dbg - RtlAllocate 0x335b Bytes
Once the region is allocated, the shellcode then accesses its own processes Process Envonrment Block aka the PEB, to retrieve the full command line given.
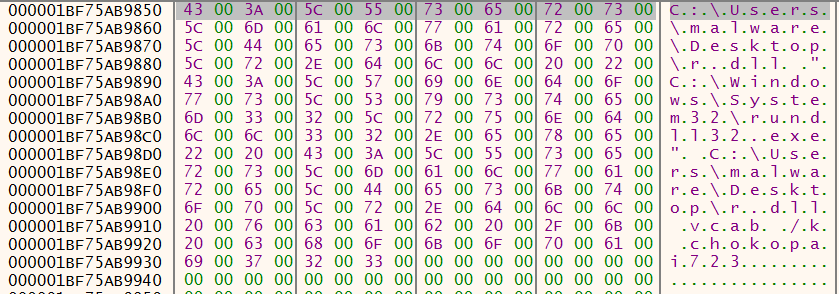
Figure 15: x64dbg - Command line copied from Process Environment Block
Probably not surprisingly, this second shellcode also implements a memcpy routine, as shown in Figure 16.
It is first used to copy 0x1EAD (7853) bytes from 0x0814E39580C (file offset 0x2C80C within the .reloc section) to a heap allocated region.
Figure 8 above contains the value 0x1EAD within the configuration block at offset 0x17FD0.
For future reference, the screen shot below shows the destination address in the RCX register as 0x023D5D94A0B0.

Figure 16: radare2 - DPX.dll shellcode memory routine.
Extracting the data that was just copied reveals not too much, and you might be able to spot a familiar pattern occurring.
Shellcode Patching
Moving on to the next call of the memcpy routine, the sample copies 0xC4E (3150) bytes from the very first allocated memory region to the tail of the data written into the heap region previously described.
This second chunk of data being copied was originally transferred from 0x0814E394BBE (file offset 0x2BBBE) into memory region 1, where is was then de-obfuscated.
The data copied into this heap region becomes very relevant later on. At this stage there is some missing information so don’t dump the memory region just yet. To clarify, the first chunk is obfuscated in some way, the second chunk is valid shellcode.
The next call the memcpy routine is used to copy a more 4 bytes containing the value 0x5B330000 into a location within the first allocated memory region. If we swap the endianness of 0x5B330000 we get 0x335B, matching the size of a previously copied segment of shellcode… very interesting…
Next, the shellcode’s routine for locating a procedure based on its hash is used to locate CreateThread.
This location is then used to patch the shellcode that was written into the first region of allocated memory, using the memcpy routine.
Figure 17 shows the start of the memcpy routine with the shellcode to be patched in the lower pane.
Currently, the 8 bytes to be patched contains 0xA1A2A3A4A5
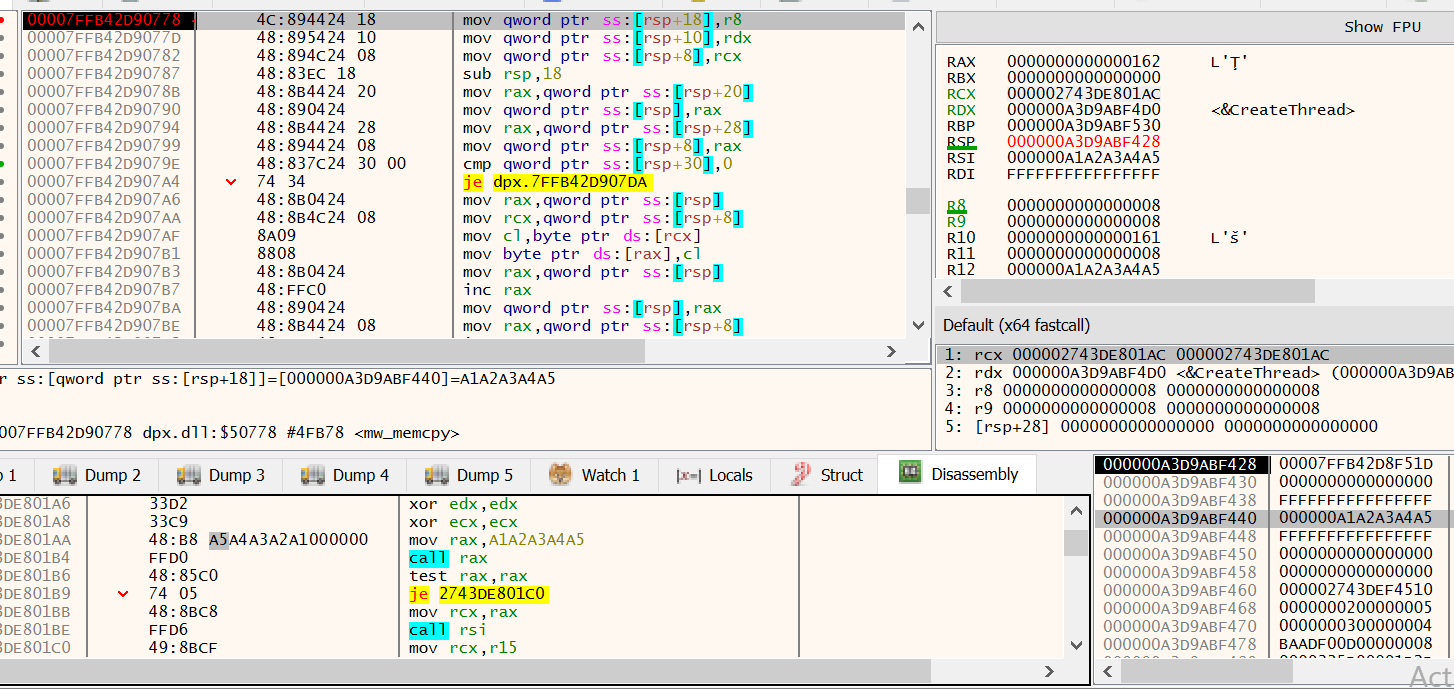
Figure 17: x64dbg - Shell code patching routine, before patch.
Figure 18 shows the shellcode after being patched, containing the address of CreateThread ready for it to be copied into RAX and then called.
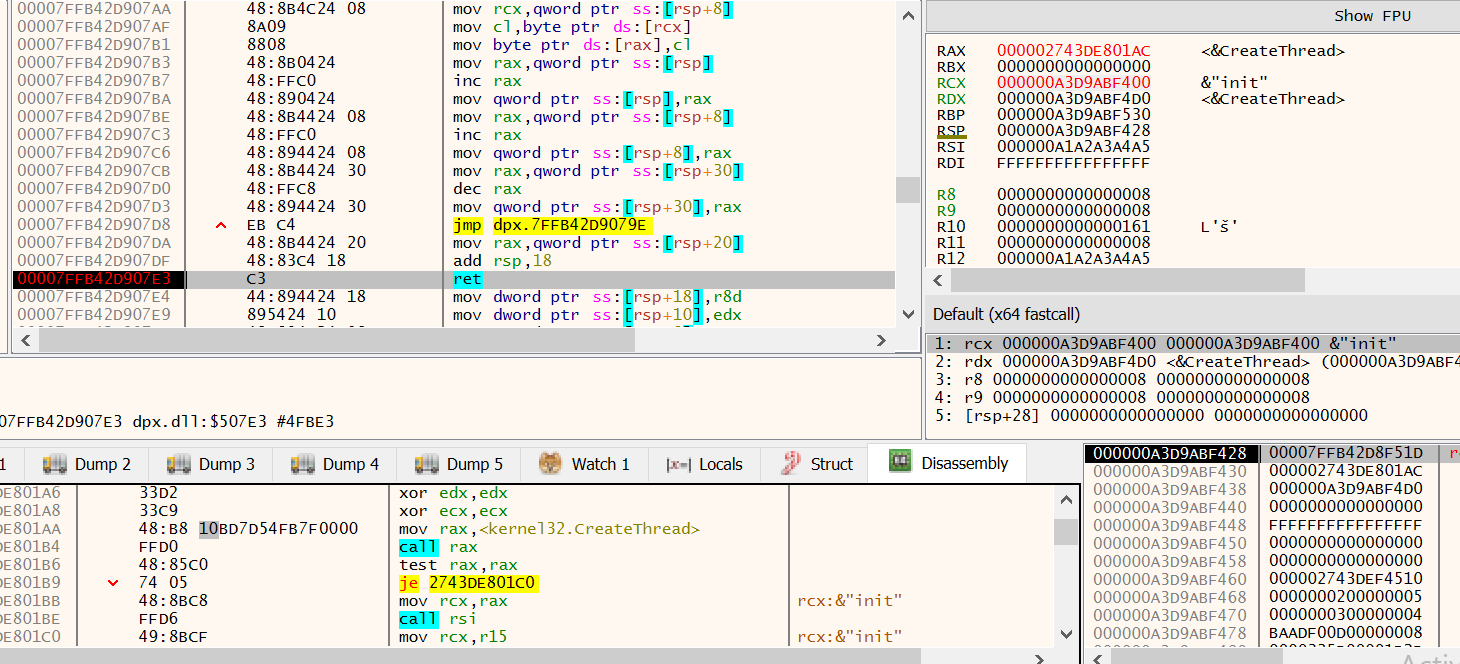
Figure 18: x64dbg - Shell code patching routine, after patch.
The same process of locating a function, and then patching shellcode is also carried out for additional functions.
The complete list of functions resolved and patched is:
- CreateThread
- LoadLibraryA
- ReadProcessMemory
- VirtualProtect
- RtlAllocateHeap
- NtClose
- ZwCreateThreadEx
Next comes a routine that appears (at least to me), to parse the ntdll.dll module for the various syscall operations.
Continuing the execution again we hit another call to the memcpy routine, this time copying 0xB (11) bytes from a stack based address into a location within the first allocated memory region.
4C 8B D1 B8 00 00 00 00 0F 05 C3
At first glance the purpose of the byte sequence is not obvious, it’s certainly not an address as previously observed.
If you continue to view the disassembler during the memcpy routine, you would have seen a patch applied to call a syscall directly.
We can quickly check the above hexadecimal opcodes using the CyberChef10 recipe to Disasemble X86 or use the following rasm2 command.
$ rasm2 -a x86 -b 64 -d '4C 8B D1 B8 00 00 00 00 0F 05 C3'
mov r10, rcx
mov eax, 0
syscall
ret
This syscall related activity has a lot of similarities with what is described here over at www.ired.team
Once the syscalls stubs have been copied over, the function ZwAllocateVirtualMemory, is then used to request 0x3841 (14401) bytes of memory with the protection constant PAGE_WRITECOPY, this region will be labelled and hence forth known as memory region 2.
Figure 19 shows the call to ZwAllocateVirtualMemory being made. The registers RDX and R8 are being used to provide the address and protection flags.
As can be seen in the display, RCX contains the location of memory, which contains the location in memory that is being altered….aka a pointer.
The address being altered here is stored in little-endian, and is 0x29E3E670000 as shown in the lower dump 2 pane.
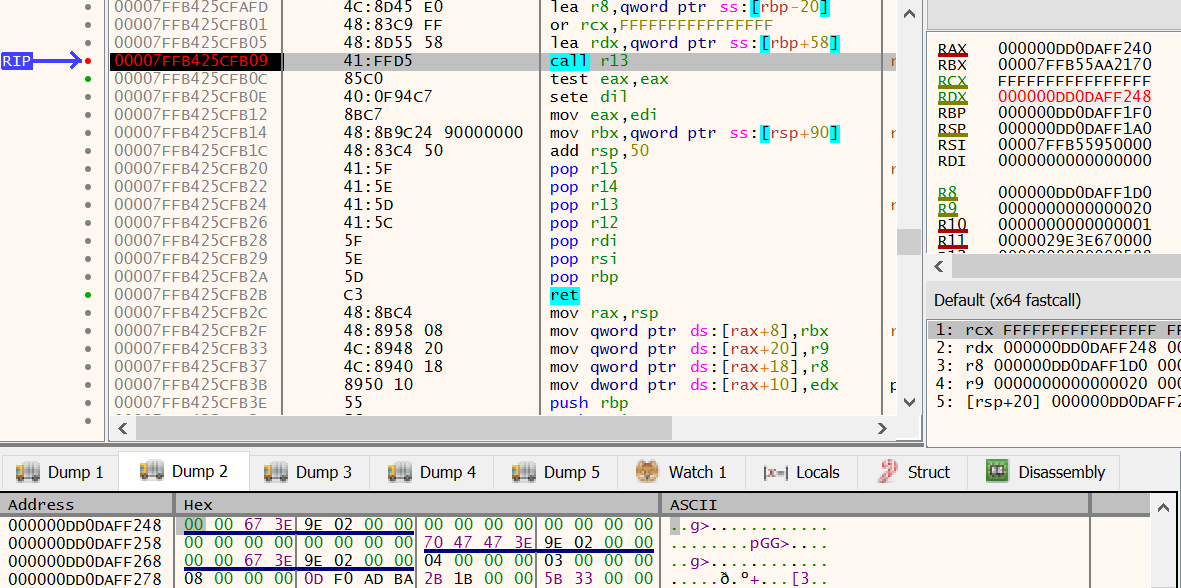
Figure 19: x64dbg - ZwProtectVirtualMemory from R13 register
After building the syscall routines and patching the shellcode in memory region 1, more API’s are resolved.
- NtOpenProcess
- NtClose
- RtlFreeHeap
The malware went to a lot of trouble to generate the syscall stubs, it finally begins to use them starting with a call via the RSI register.
Setting an execution breakpoint on the region of memory containing the syscall stubs will allow you to step through the next procedure.
Figure 20 shows the call via the RSI register, with a value of 0x5 being passed in on the RCX register.
In the disassembly view in the bottom pane, you can see the syscall ID being loaded into RAX, the value 0x36 resolves to NtQuerySystemInformation11
Taking a look at the documentation for NtQuerySystemInformation here provided by Geoff Chappell, the value 0x5 is the constant for SystemProcessInformation.
This is being used to generate a process listings, more details can be found here
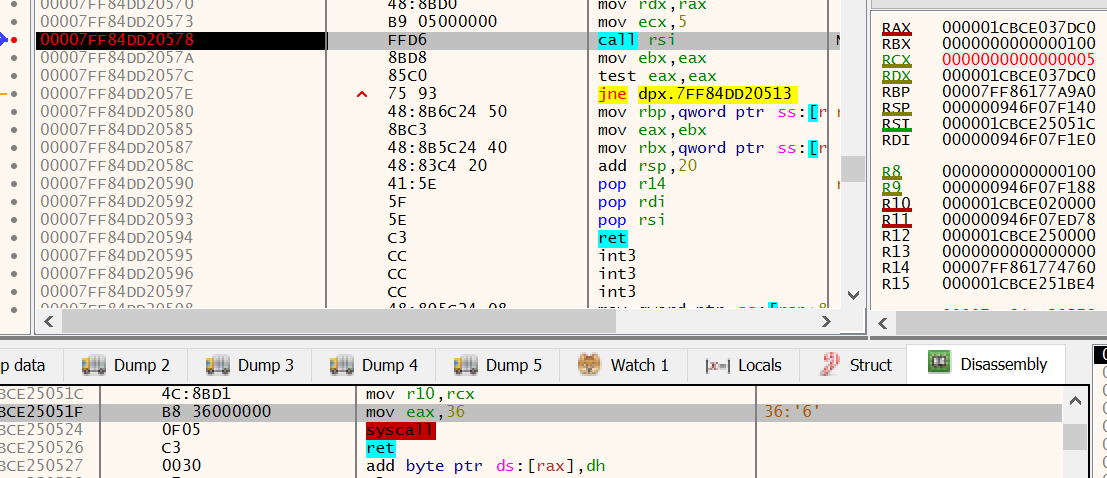
Figure 20: x64dbg - NtQuerySystemInformation native syscall
Once the PID for explorer.exe is located, it is passed to the NtOpenProcess syscall.
Opening the rundll32.exe process in ProcessHacker we can see the handle to explorer.exe has been opened, as shown in Figure 21.
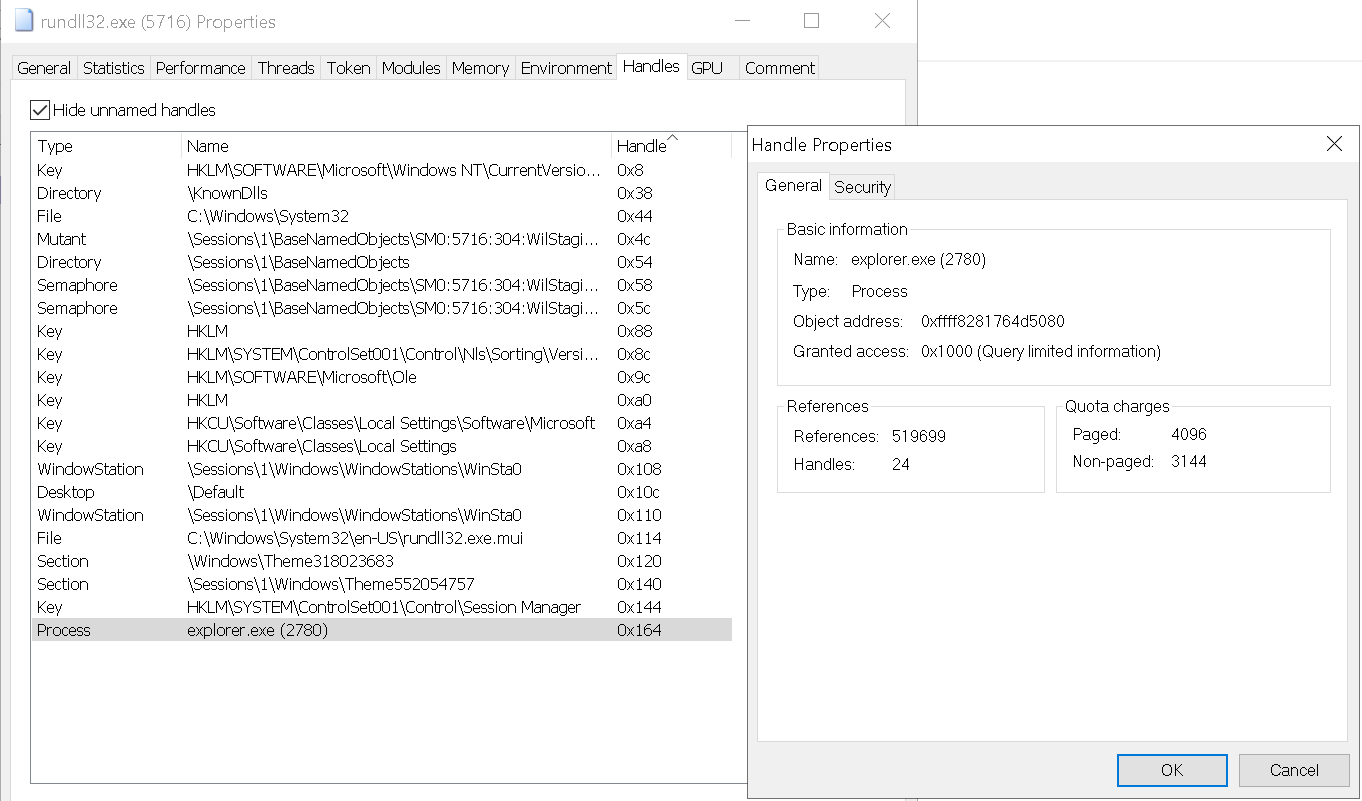
Figure 21: ProcessHacker - Handle to explorer process opened.
The handle on explorer.exe is then used by a call to NtOpenProcessToken.
The returned handle for the token is passed to NtQueryInformationToken before being closed with NtClose.
The syscall NtSystemQueryInformation is then used as it was previously to generate a list of processes running on the system.
A series of calls to NtOpenProcess is then issued against all svchost.exe processes until one can be successfully opened.
As the process is running in a non-privileged context, calls to svchost.exe processes running as NT AUTHORITY\SYSTEM are responded to with an access denied value in EAX as shown in Figure 22

Figure 22: x64dbg - NtOpenProcess Access Denied.
Note: The sihost.exe process is also attempted if the svchost.exe process list becomes exhausted.
Once a handle to an svchost.exe process is opened, the token information is harvested using NtOpenProcessToken and NtQueryInformationToken.
To determine if the target svchost.exe process is the correct architecture, NtQueryInformationProcess is used to check the ProcessWow64Information details.
For each thread on the svchost.exe process the following routines are called:
- NtOpenThread
- NtCreateEvent
- NtDuplicateObject
- NtQueueApcThread
- SetEvent
Once each thread has been setup, there is a call to NtQuerySystemTime.
The shellcode residing in memory region 1, is further patched with the value 0xB18 forming the first argument to ReadProcessMemory as shown in Figure 23.

Figure 23: x64dbg - Length value being patched in shellcode
Using the handle to svchost.exe, the rundll32.exe process makes a call to NtVirtualProtect targeting the address of WinHelpW from user32.dll.
Looking at the R9 register in Figure 24 you can see the value 0x40, which corresponds to the memory protection constant PAGE_EXECUTE_READWRITE.

Figure 24: x64dbg - NtVirtualProtect WinHelpW
Payload Transfer
The rundll32.exe process then calls NtCreateSection to create a section within the svchost.exe process.
This section is then mapped into view of the rundll32.exe process using NtMapViewOfSection.
With the section accessible to the rundll32.exe process, the memcpy implementation is called twice.
The first transfer copies 0x4A bytes, and the second transfers 0x18F bytes from the first memory region.
You’ll notice the byte sizes align with the blocks of data transferred from the .reloc section into “memory region 1”, which has been decoded and subsequently patched.
The original bytes from both WinHelpW (0x4A) and WinHelpA (0x18F) are copied into a location of memory, possibly for restoring later.
Once data has been written by the rundll32.exe process, NtUnMapviewofSection is called on the section.
Using the handle to the svchost.exe process, the section is mapped into memory using NtMapViewOfSection.
Now comes a really interesting process, to avoid using heavily monitored API’s the rundll32.exe process such as WriteProcessMemory.
The rundll32.exe processes calls the NtQueueApcThread routine to schedule an execution of RtlCopyMemory within the svchost.exe process. The source parameter is the location of the mapped memory region of the shared section, the destination parameter contains the address of the WinHelpW routine within user32.dll.
Thus when the queued APC routine executes, the WinHelpW routine will be replaced with shellcode.
The setup for this can be seen in Figure 25 below.

Figure 25: x64dbg - WinHelpW execution after NtDelayExecution
The same technique is then used to copy data from the mapped section, to overwrite the WinHelpA routine.
The shellcode at WinHelpW is then scheduled to execute using the NtQueueApcThread routine as well as Sleep and a call to NtDelayExecution.
Both the WinHelpW and WinHelpA locations have their memory protection restored back to PAGE_EXECUTE_READ using NtVirtualProtectMemory, and the section becomes unmapped in the svchost.exe process with a call to NtUnMapviewofSection.
Execution from this point will continue from within the perspective of the svchost.exe process.
Setting a breakpoint on the WinHelpW routine, we can examine this further.
Executing WinHelpW Shellcode
$ r2 -AA -c 'pdf' svchost_user32_injected.bin
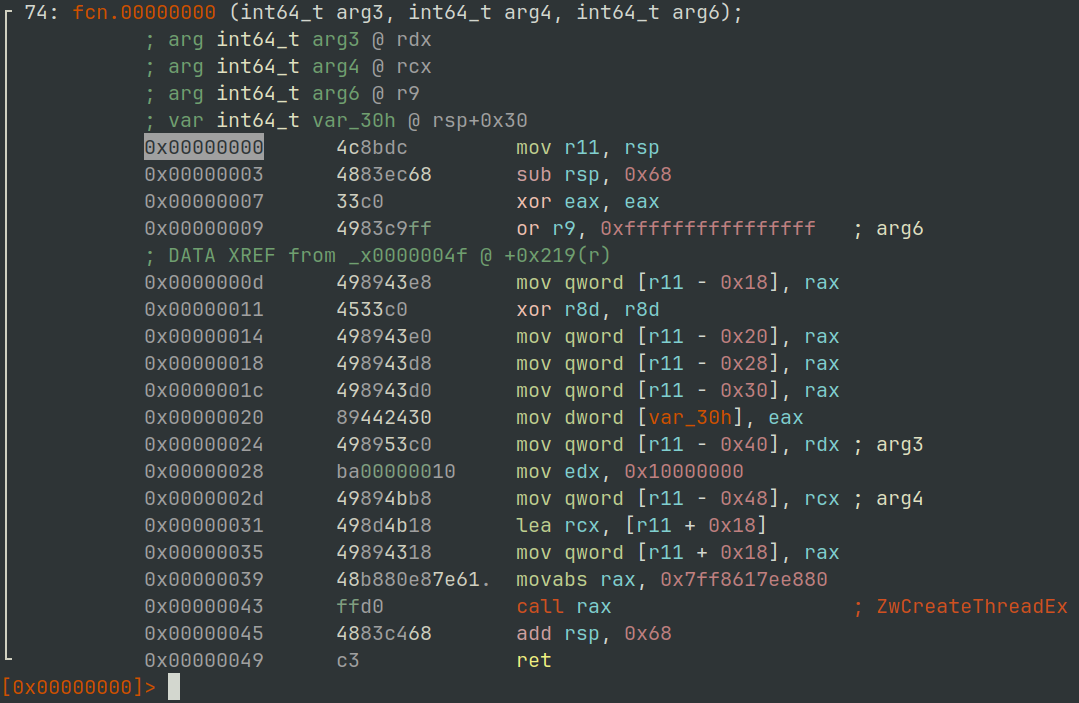
Figure 26: radare2 - svchost.exe User32.dll WinHelpW Shellcode
Calls to OpenProcess on the rundll32.exe process.
Then ReadProcessMemory from the rundll32.exe process, the heap allocated data previously described.

Figure 27: x64dbg - ReadProcessMemory called from svchost.exe
As you can see from the screen shot in Figure 28, some of the data copied may contain a similar configuration block identified with the init keyword. Further down into the bytes you may also spot the bytes 0xD6, 0xB2, 0x07 and 0x00 which was the XOR key used within the rundll32.exe unpacking staged.

Figure 28: x64dbg - svchost.exe init configuration block
Taking a look at the shellcode that was placed at WinHelpA statically in Figure 29, we can see it contains the string dpx.dll and will call LoadLibraryA to load it.
It then calls VirtualProtect on the routine DpxCheckJobExists to allow a byte copying routine to overwrite its contents, replicating the behaviour from earlier in the unpacking routine.
$ r2 -AA -c 's 0xe2; pd 40' svchost_user32_injected.bin
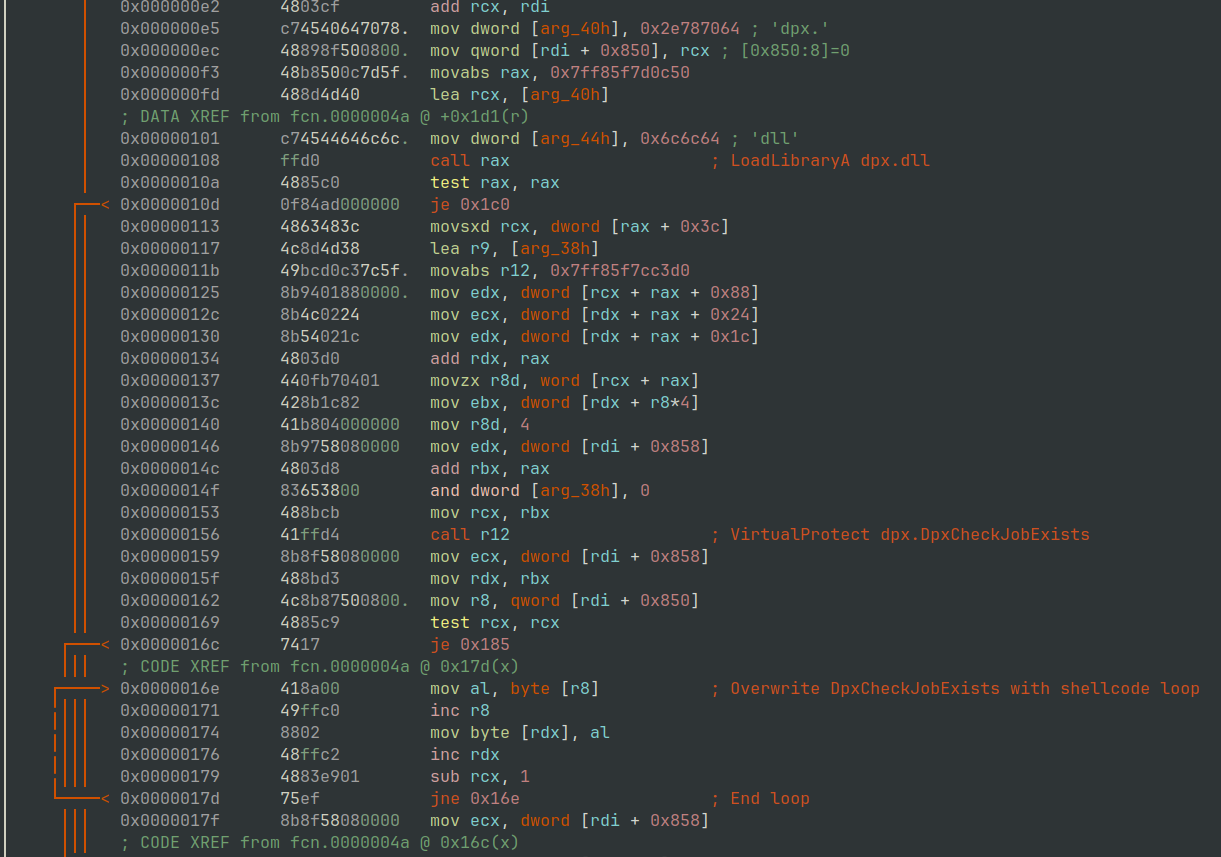
Figure 29: radare2 - LoadLibraryA dpx.dll and overwrite DpxCheckJobExists
If you are viewing this dynamically then, you will observe 0xC4E (3150) bytes from the second chunk of data copied from the rundll32.exe process into dpx.DpxCheckJobExists routine.
A call to CreateThread is then issued with a base address of dpx.DpxCheckJobExists
The shellcode located at dpx.DpxCheckJobExists then kicks of a routine to XOR decode some of the remaining data originally sourced from rundll32.exe.
Payload Decrypting
In Figure 30 below we can see the static disassembly output of the XOR routine used.
$ r2 -AA -c 's 0x57; pd 72' svchost_dpx_dpxcheckjobexists.bin
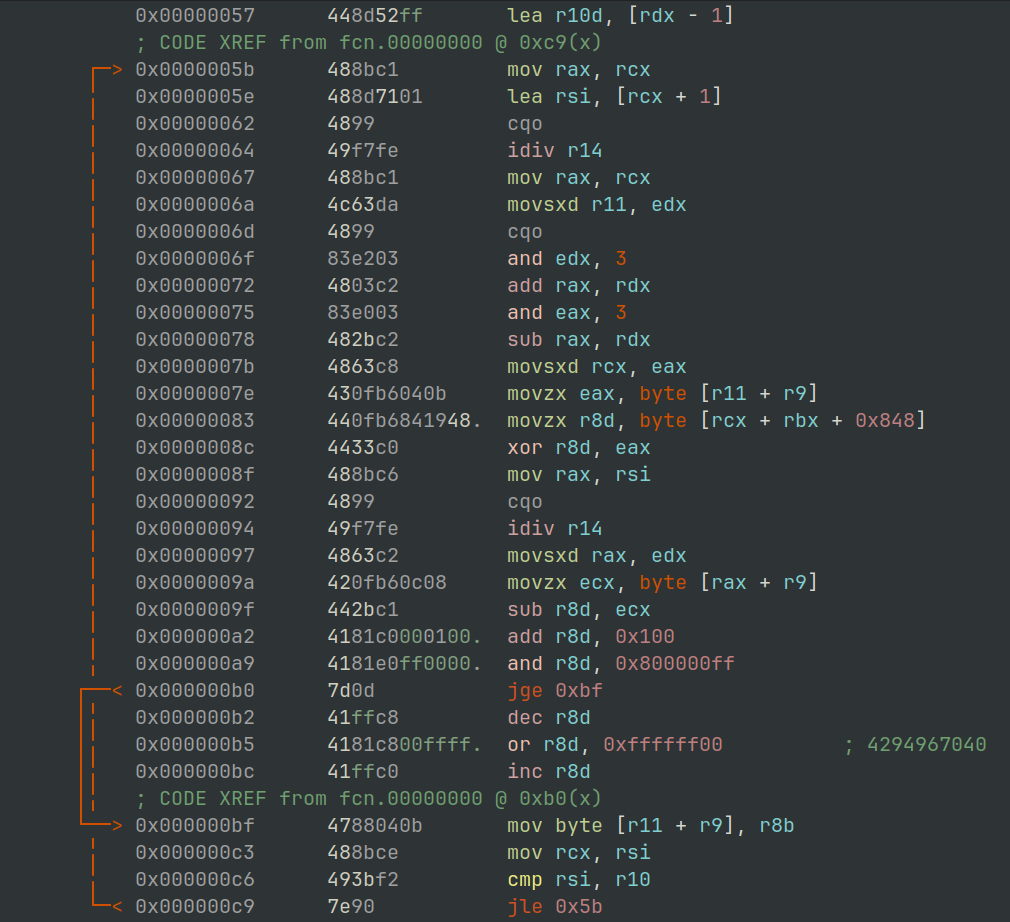
Figure 30: radare2 - XOR Routine
This routine is used to reveal the FINAL PE file payload in its original memory buffer copied over from rundll32.exe, as shown in Figure 31 there is an MZ header and DOS stub visible.

Figure 31: x64dbg - Decoded DOS stub header
As well as the executable file, there also resides some configuration data that is used to allow shellcode to map the PE into the address space.
Value 0x3400 taken from payload structure and passed to RtlAllocateHeap
The PE file is the seemingly copied into this allocated memory region.
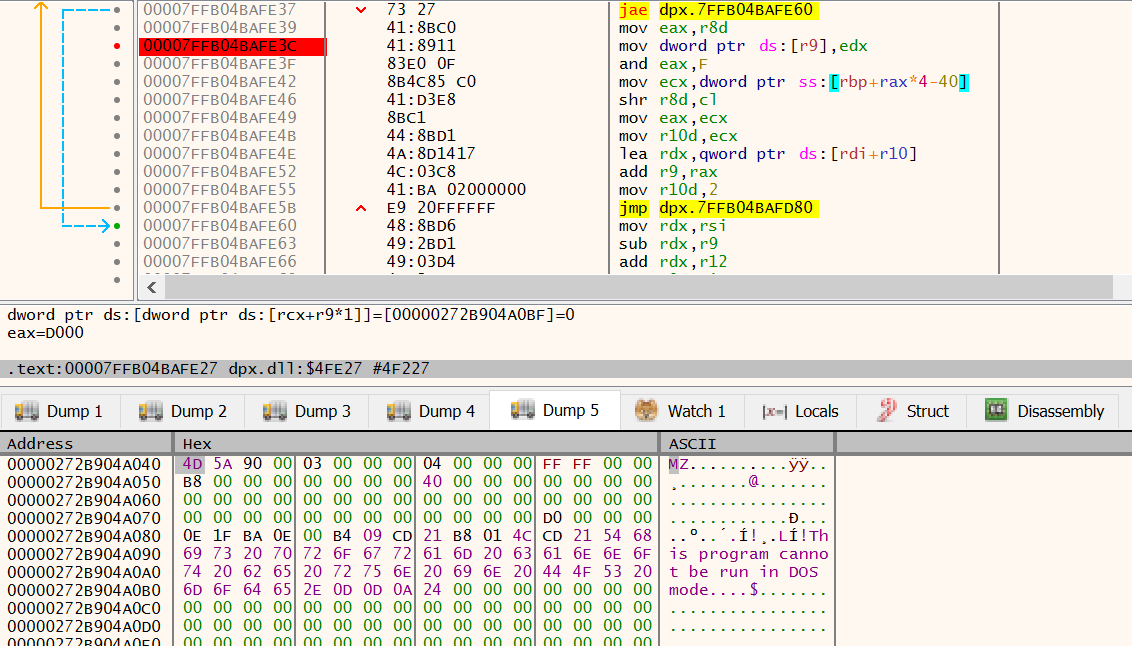
Figure 32: x64dbg - MZ header being copied into allocated Heap region
Pausing the debugger here, will allow you to extract the executable file before it gets mapped into memory.
As the shellcode within the dpx.DpxCheckJobExists area executes, it calls VirtualAlloc with a base region of 0x0180000000, a size of 0x3000 (12288) bytes and a page protection flag of 0x40 (PAGE_EXECUTE_READWRITE).
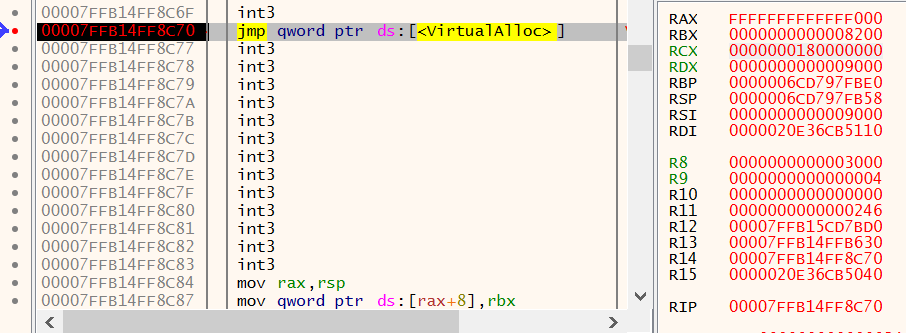
Figure 33: x64dbg - VirtualAlloc hardcoded 0x0180000000
Once this very specific location of memory is allocated the PE file is mapped into execute, the process for this is well documented elsewhere.
Once mapped, execution is started using a call to CreateThread using the 0x01800028D4 address as the entry point.

Figure 34: x64dbg - CreateThread hardcoded 0x0180000000
Unpacked Payload
Now we have jumped through the many hoops to unpack the final payload, we can validate the contents by loading it into PE-Bear12.
As you can see from Figure 35, the binary lists some imports from the WINHTTP.dll that look like might be worthy some additional analysis.
You can find a copy of the file svchost_icedid_unpacked.bin in the GitHub repository for this blog post here, or on the malware Bazaar here.
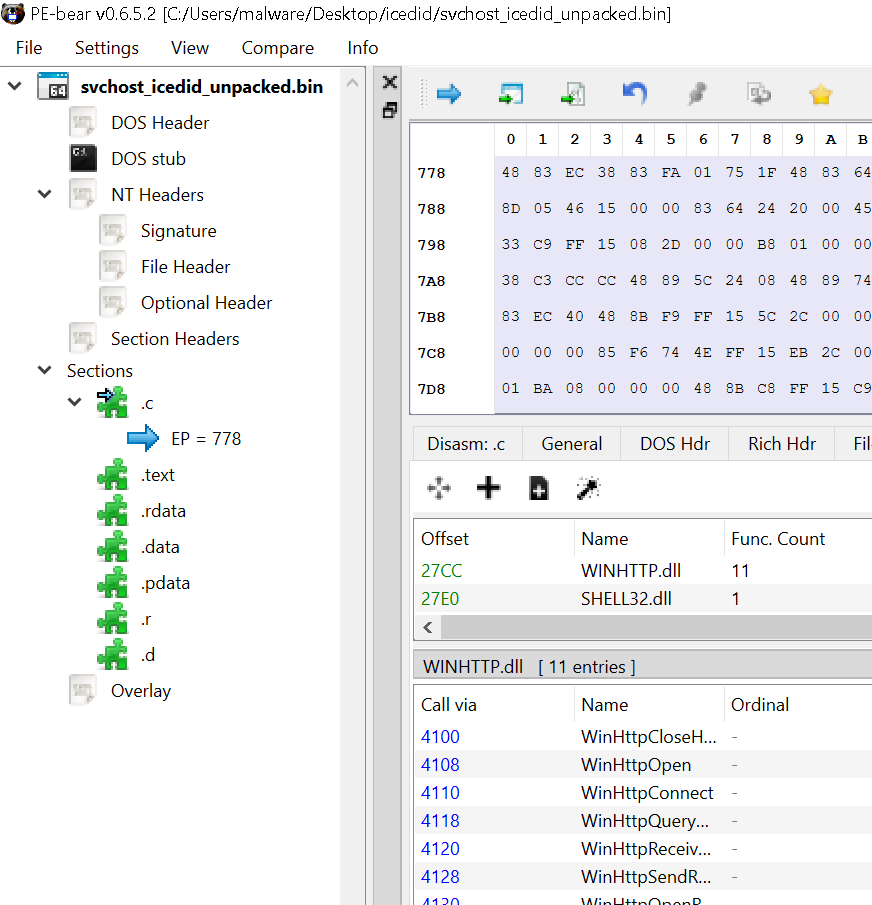
Figure 35: PE Bear - Unpacked icedid payload from svchost.exe
Final Words
That’s it for this blog post, its been quite in depth and low-level. If you want to understand anything covered, or maybe not covered in this post feel free to reach out.
I’m planning to do a part 4 taking a look into the extracted PE file so keep an eye out for that, and in the meantime keep evolving.
References
-
https://learn.microsoft.com/en-us/cpp/c-runtime-library/reference/memcpy-wmemcpy ↩
-
https://learn.microsoft.com/en-us/windows/win32/api/memoryapi/nf-memoryapi-virtualalloc ↩ ↩2
-
https://learn.microsoft.com/en-us/windows/win32/Memory/memory-protection-constants ↩
-
https://learn.microsoft.com/en-us/windows/win32/api/memoryapi/nf-memoryapi-virtualprotect ↩
-
https://learn.microsoft.com/en-us/windows-hardware/drivers/ddi/ntifs/nf-ntifs-rtlallocateheap ↩
-
https://learn.microsoft.com/en-us/windows/win32/api/winternl/nf-winternl-ntquerysysteminformation ↩